Data visualization best practices guide
[Ad Space — Insert ad script here]
Downloads
This Markdown download is text-only (figures are summarized, not embeddedÔÇöopen the live page for charts). Add it to your IDE or agent context so assistants can follow these guidelines.
1. Start with the message, not the chart
Before choosing a chart type, define what you want to communicate.
Ask:
What is the main idea?
Who is the audience?
What decision or discussion should this chart support?
Where will the chart be used: dashboard, document, or live presentation?
How much time will the audience have to interpret it?
Avoid starting with:
Which chart looks nice?
Which chart does the tool suggest?
Which chart did I use last time?
A good chart often communicates one main point. If the audience needs to discover the message by inspecting every label, axis, and legend, the chart is probably doing too much.
2. Use visual thinking
People do not read charts like they read text. In text, readers usually follow a sequence. In charts, the eyes move toward what stands out:
Strong colors
Large objects
Bold text
Outliers
Peaks and valleys
Intersections
Labels
Highlighted areas
Unexpected patterns
This means you must actively guide attention.
If the main insight is a line crossing another line, make that crossing obvious. If one category matters most, highlight it. If the conclusion is a gap, emphasize the gap.
The audience should not have to search for the point.
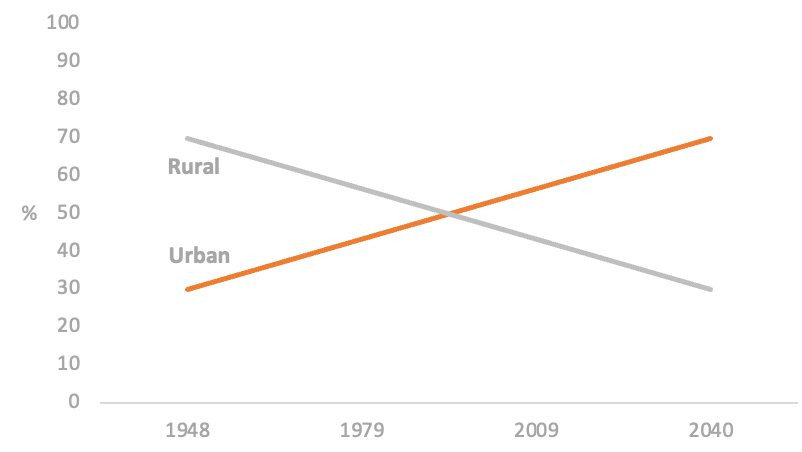
Attention goes to the strongest visual cue firstÔÇöfor example the intersection of two linesÔÇöbefore the audience reads labels and axes sequentially.
3. Respect visual perception limits
People can only process a limited number of visual elements at once.
As a rule of thumb:
Few elements  individual comparison is possible.
Many elements  the audience sees an overall pattern instead.
Use this intentionally.
If the goal is to compare individual categories, limit the number of elements. If the goal is to show a general trend or distribution, many elements can work, as long as the overall pattern is clear.
Example:
Show 5 product categories if the audience must compare them.
Show 100 customer trajectories if the goal is to reveal a broad behavioral pattern.
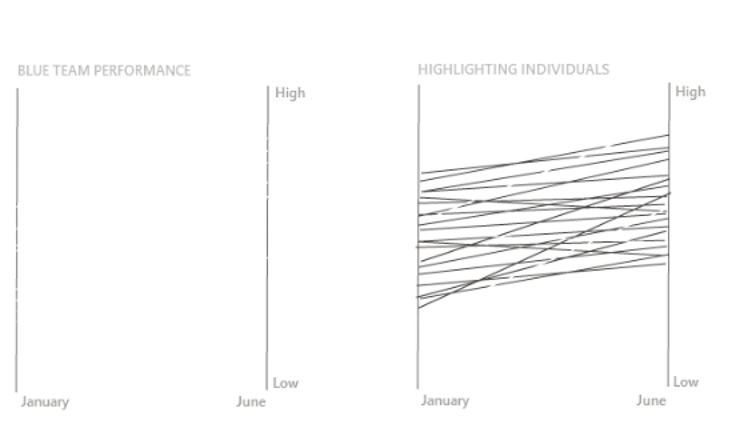
Many lines can stop being read one-by-one and instead read as a single pattern; highlighting selected series while muting the rest keeps both views useful.
4. Avoid misleading patterns
The audience naturally looks for meaning, patterns, trends, and relationships. This is powerful, but dangerous.
Be careful with:
Color choices
Category order
Axis scales
Time windows
Missing context
Truncated axes
Dual axes
Inconsistent intervals
The same data can tell very different stories depending on the time period, scale, grouping, or reference point.
For example, a trend may look stable over ten years but alarming over three months. Both may be technically true, but the chart must make the chosen context clear.
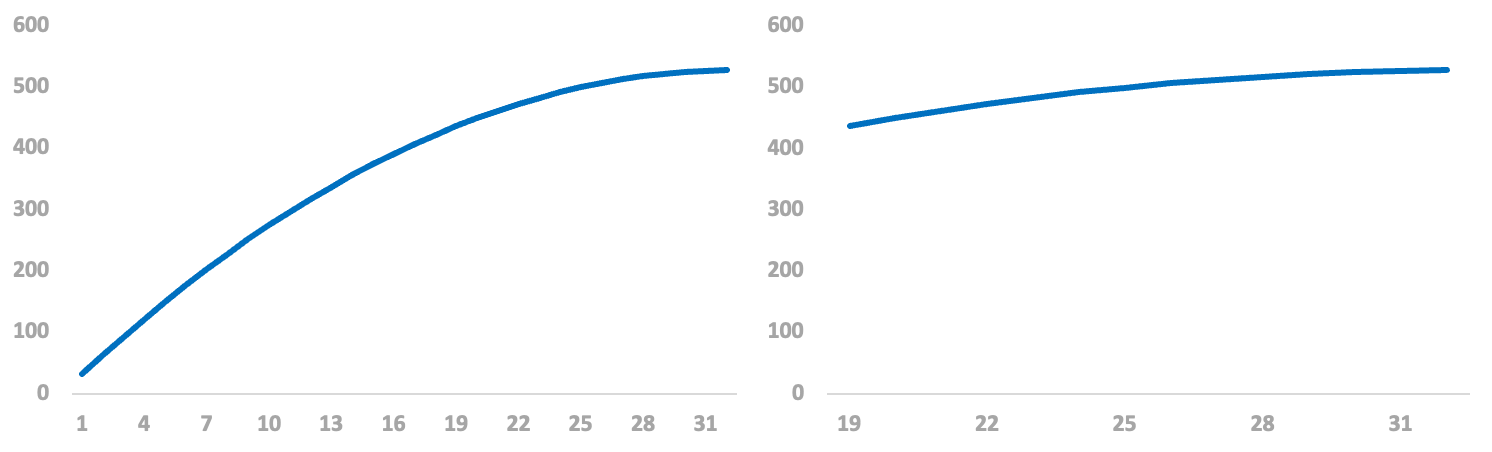
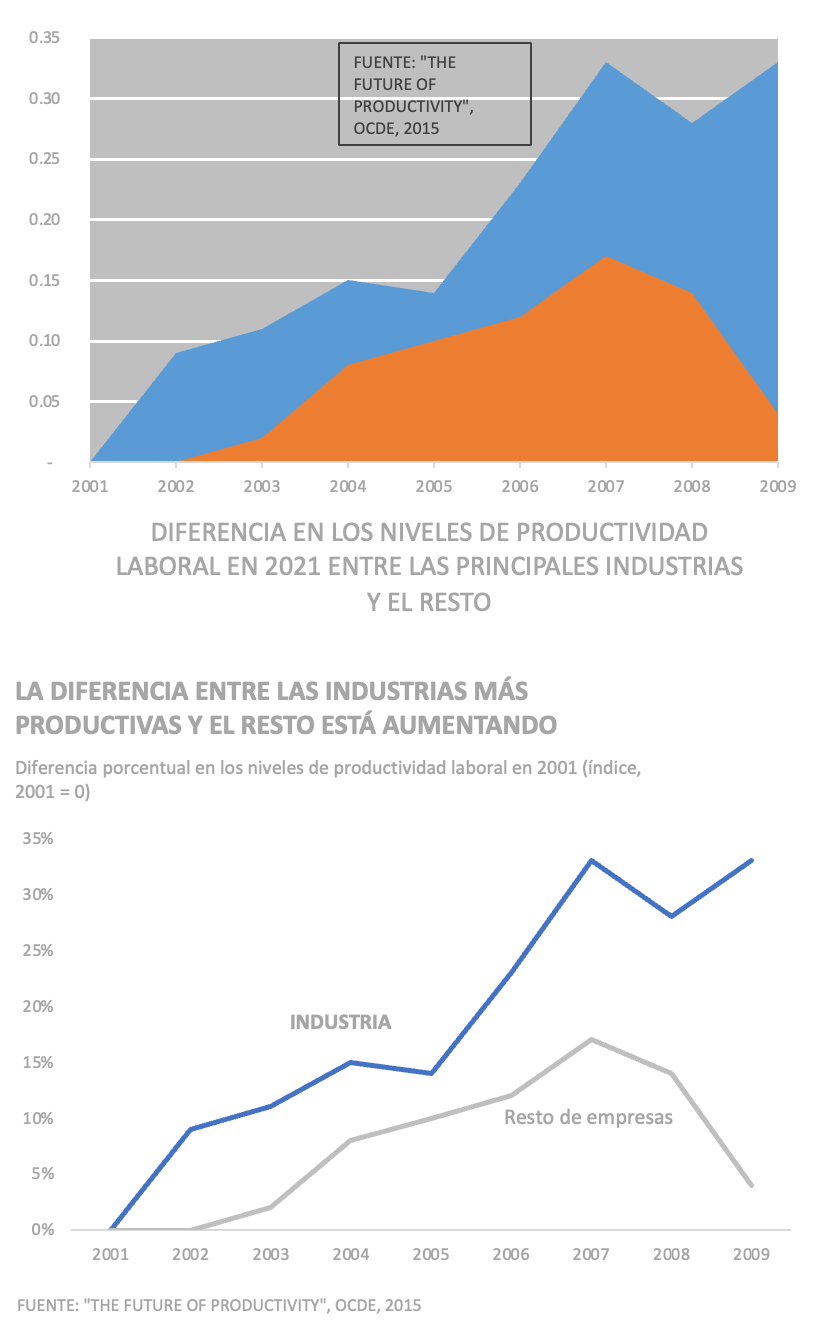
The same series can imply a different story depending on the time windowÔÇöalways make the framing explicit.
5. Respect conventions
Charts are easier to understand when they follow familiar conventions.
Common conventions:
Time goes on the horizontal axis.
Time moves from left to right.
Higher values go upward.
Red often means bad or warning.
Green often means good or positive.
Blue often suggests cold or neutral.
Similar colors imply similar categories.
Darker or more saturated colors imply higher importance or value.
Categories should be ordered logically or by value.
Breaking conventions increases cognitive effort and can mislead the audience.
Only break conventions when there is a strong reason, and make the design very clear.
Logical category order and meaningful color speed interpretation and reduce accidental misreading.
6. Choose the best available chart
There is rarely a perfect chart. The goal is to choose the best available option for the message, audience, and medium.
A practical process:
1. Write the message in one sentence.
2. Identify the key action words: compare, show trend, rank, relate, distribute, compose.
3. Sketch possible charts before building them.
4. Prototype with real or realistic data.
5. Remove, simplify, and refine.
Example:
ÔÇ£I want to compare the number of job postings to hires across job types.ÔÇØ
Key ideas:
Compare
Ratio
Different categories
This suggests a chart that compares ratios across categories, such as a bar chart or dot plot.
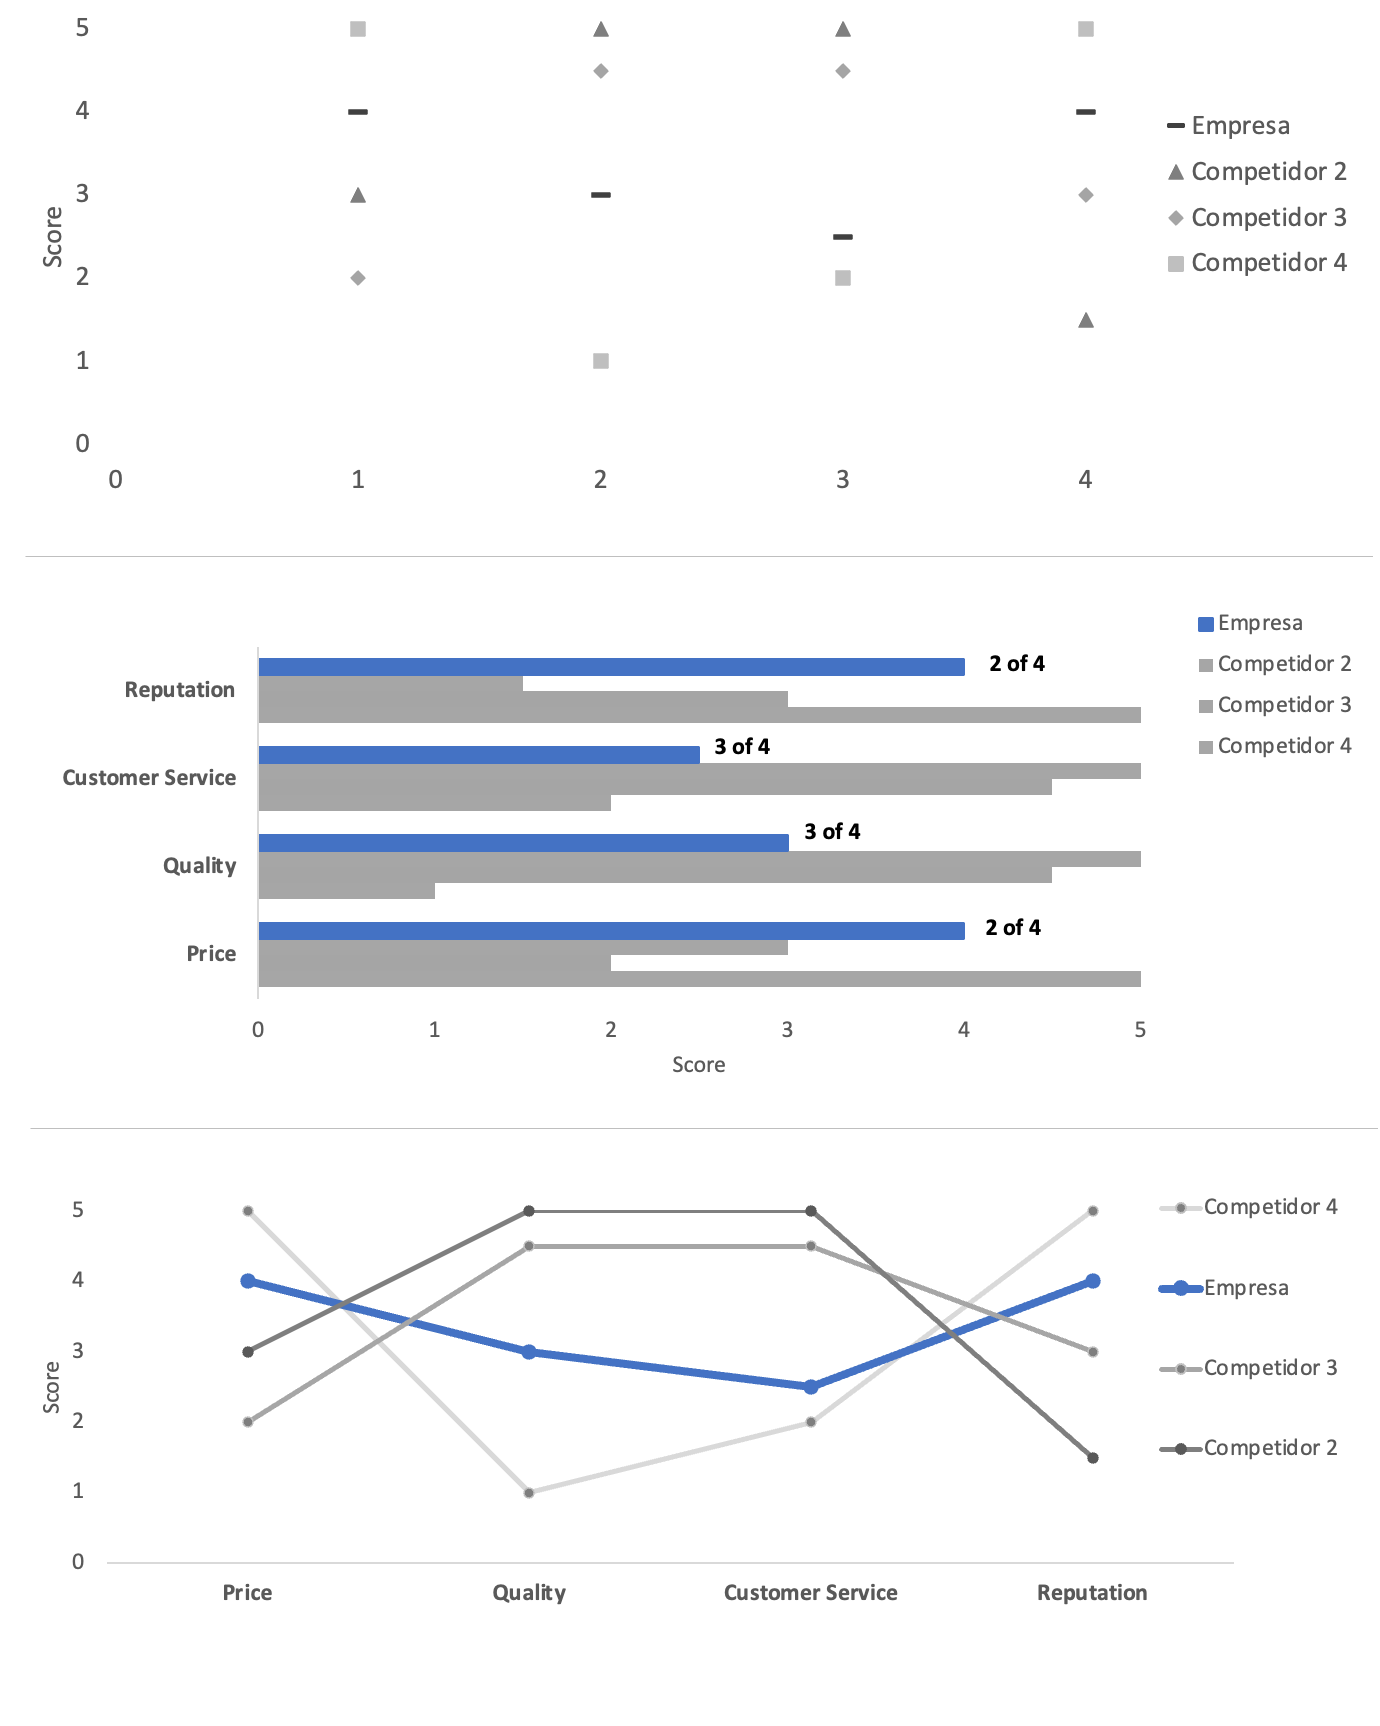
Iterate across alternativesÔÇödensity, simplified bars, color, line comparisonsÔÇöbecause the ÔÇ£bestÔÇØ chart depends on context, not a single default.
7. Prefer simple charts
Simple charts are usually more effective than sophisticated ones.
Most business communication can be handled with:
Simple text
Tables
Heatmaps
Bar charts
Line charts
Scatterplots
Slopegraphs
Waterfall charts
100% stacked bars
Use complex charts only when a simpler chart cannot communicate the message.
Complexity is not bad by itself, but the audience must be able to understand the chart quickly enough for the situation.
A chart for a live executive presentation should usually be simpler than a chart in a detailed analytical appendix.
Fewer colors, fewer ornaments, and less decimal noise usually improve clarity without changing the underlying message.
8. Structure the chart clearly
A good chart has a clear visual hierarchy.
Useful starting structure:
Title: around 10ÔÇô15% of the space
Subtitle: around 5ÔÇô10%
Chart field: around 70ÔÇô80%
Source / footnote: around 5%
These proportions are not strict rules, but they help create balance.
The title should communicate the message, not merely describe the chart.
Weak title:
Sales by Month
Better title:
Sales declined sharply after March
The title should answer: What should the audience notice?
9. Use alignment and whitespace
Good alignment makes a chart feel professional and easier to read.
Best practices:
Align titles, subtitles, axes, and source notes.
Avoid diagonal text.
Use left alignment for most text.
Use consistent spacing between elements.
Leave enough margin around the chart.
Do not fill every available space.
Whitespace is not wasted space. It helps the audience focus.
A single important number on a mostly blank slide can be more powerful than a crowded dashboard page.
Stronger alignment, clearer structure, and deliberate whitespace make the same data faster to read.
10. Lead the audience to the main idea
Use visual emphasis deliberately.
The main tools are:
Contrast
Color
Saturation
Thickness
Position
Labels
Annotations
Reference lines
Frames
Arrows
Ordering
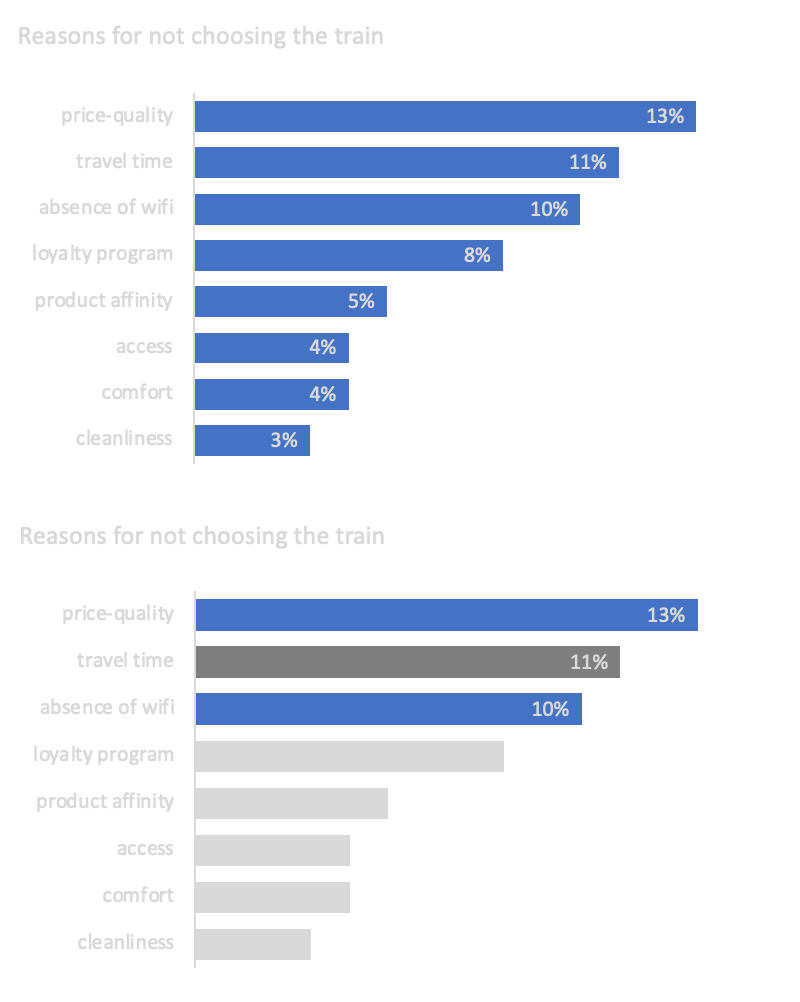
Good highlighting usually follows this pattern:
Important element  stronger color, label, or thickness.
Secondary elements  light gray, thinner lines, fewer labels.
Avoid using many colors at once. A blue item stands out among gray elements. It does not stand out among ten other bright colors.
A strong default palette is:
Gray for context
One saturated color for emphasis
Optional second color for contrast
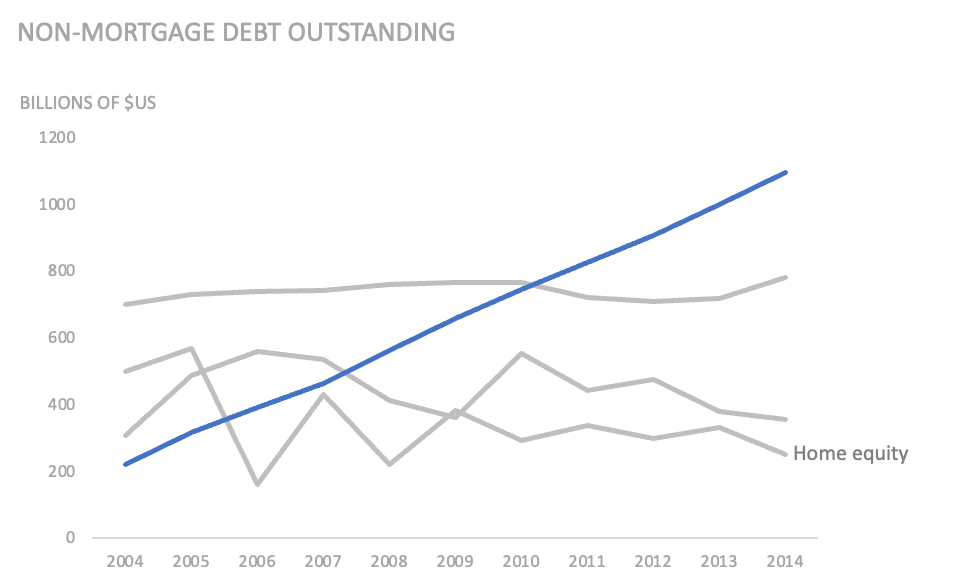
Emphasize the series or segment that carries the insightÔÇöfor example the line where debt splits fastestÔÇöso viewers see the conclusion before the footnotes.
11. Use color with discipline
Color should communicate meaning, not decoration.
Good uses of color:
Highlight the main category.
Separate positive and negative.
Show intensity.
Group related categories.
Distinguish actuals from forecast.
Represent status or risk.
Poor uses of color:
One random color per bar.
Many saturated colors with no meaning.
Changing category colors across pages.
Using red and green without considering accessibility.
Using color when direct labels would work better.
Best practices:
Use ideally two main hues.
Use saturation to show emphasis.
Keep secondary elements in light gray.
Keep category colors consistent across the full report or presentation.
Avoid bright colors unless you need strong warning or emphasis.
Use saturation tiers plus concise text so ÔÇ£normal,ÔÇØ ÔÇ£important,ÔÇØ and ÔÇ£most importantÔÇØ read instantly.
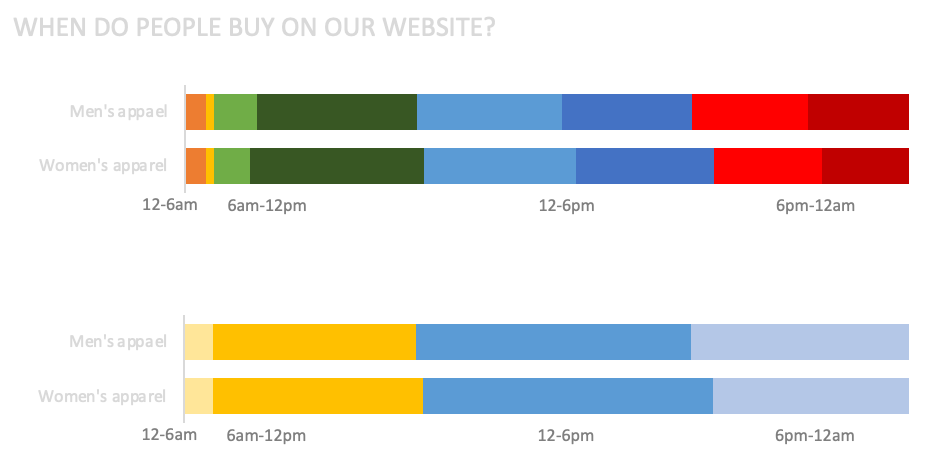
Grouping categories cuts competing hues and makes comparisons easier without hiding the story.
12. Remove unnecessary elements
Every chart element should justify its existence.
For each element, ask:
Does this help communicate the message?
Would removing it make the chart less clear?
Is there a simpler way to achieve the same purpose?
Usually remove or reduce:
Heavy borders
Dark gridlines
Unnecessary data markers
Redundant legends
3D effects
Excessive decimals
Unnecessary axis titles
Repeated labels
Decorative backgrounds
Too many tick marks
Use lighter versions when the element is useful but not central.
For example:
Use light gray gridlines instead of dark gridlines.
Use direct labels instead of a legend.
Use only the key data labels instead of labeling every point.
Strip grid clutter, prefer direct labels over noisy legends, and keep only marks that earn their ink.
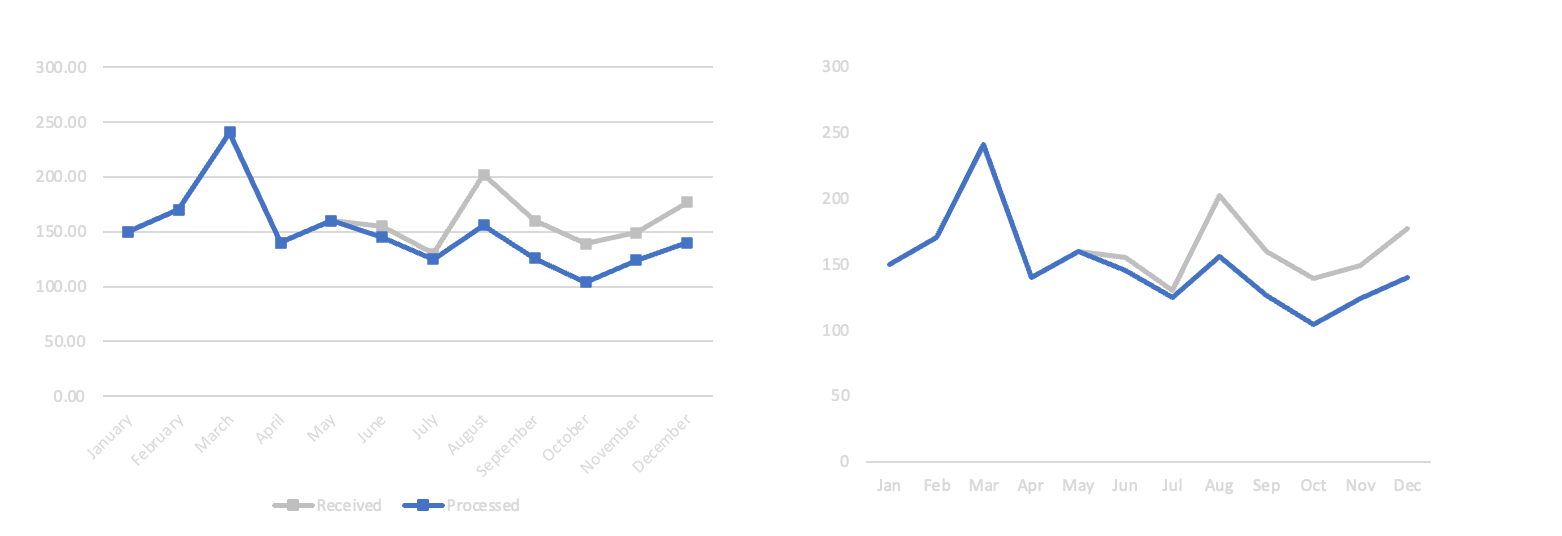
13. Reduce eye travel
Good charts keep related information close together.
Instead of placing a legend far away from the data, label lines directly.
Poor pattern:
Line chart on the left
Legend below the chart
Audience must look back and forth repeatedly
Better pattern:
Line labels placed near the end of each line
This reduces cognitive effort and makes the chart faster to read.
14. Choose the right level of detail for the medium
The same chart should not necessarily look the same in a dashboard, document, and presentation.
Live presentation
Use fewer elements.
Highlight only the key message.
Use fewer labels.
Explain verbally when needed.
Use animation to reveal complexity step by step.
Pause before speaking so the audience can read the chart.
Slides can reveal steps sequentiallyÔÇöanimations help steer attention when detail must unfold live.
Document or PDF
Include more detail.
Add source notes.
Add definitions.
Add more labels if useful.
Include footnotes.
Allow the reader to inspect the chart independently.
Dashboard
Support exploration.
Use consistent layout.
Include filters carefully.
Provide tooltips.
Avoid too much visual density.
Make definitions available.
Keep interactions intuitive.
15. Be careful with axes and scales
Axes strongly influence interpretation.
General rules:
Bar charts should start at zero.
Line charts should usually start at zero, but exceptions are acceptable.
Use constant intervals.
Make truncated axes obvious.
Clearly label logarithmic scales.
Avoid dual axes when possible.
Bar charts rely on length comparison, so a non-zero baseline exaggerates differences.
For line charts, a truncated axis can be acceptable when small changes matter and values are far from zero. But the truncation must be clear.
Better alternatives to truncating the axis:
Show absolute change.
Show percentage change.
Show an index with base 100.
Add a small reference number.
Avoid dual axes because they can create false relationships between unrelated variables. Prefer two aligned charts with the same x-axis.
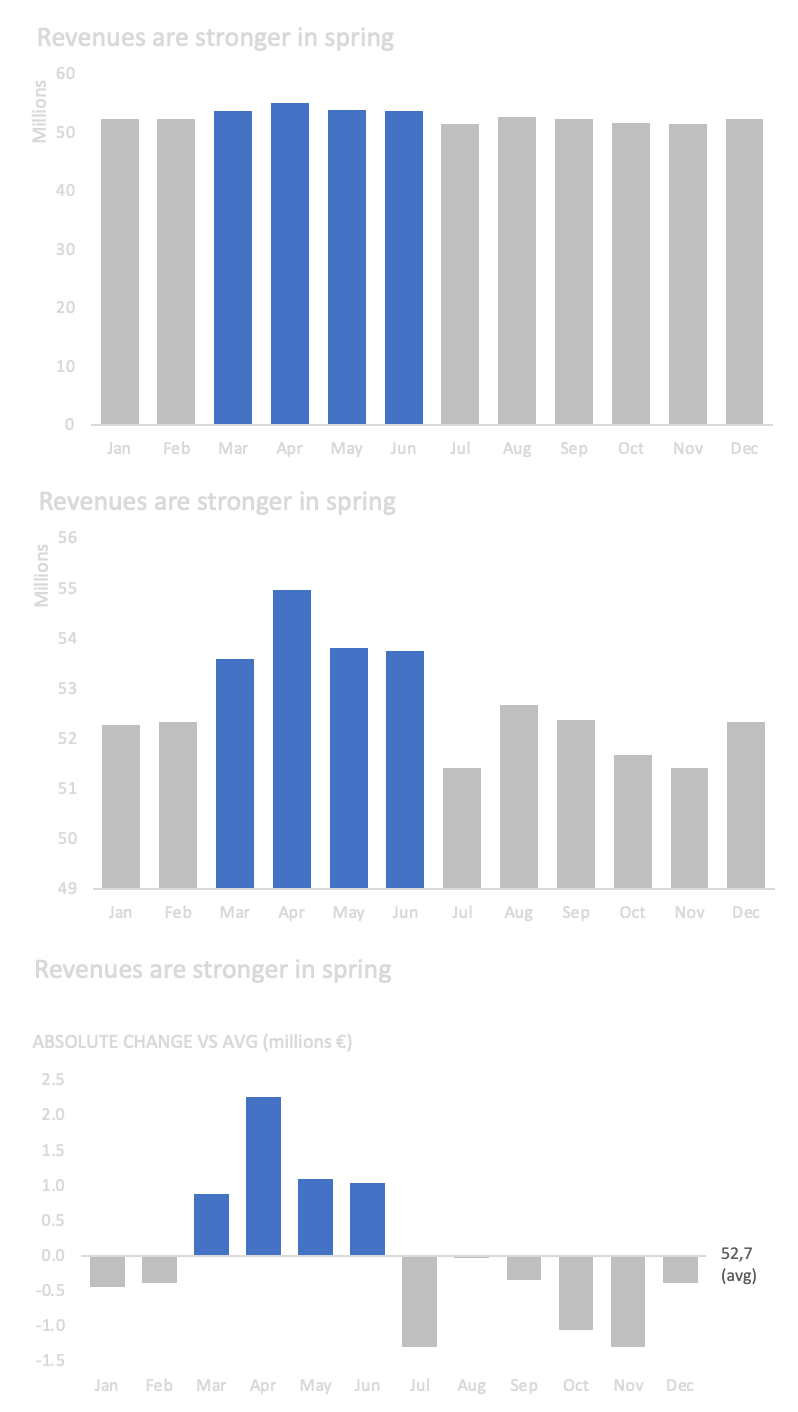
Truncated baselines, logs, absolute versus percent change, and split panels each solve scale tension differentlyÔÇöpick honestly.
16. Use reference points to improve understanding
Sometimes raw numbers are hard to interpret. Translate them into a familiar reference.
Instead of:
Employees waste 18,000 hours per year on manual reporting.
Use:
That equals around 10 full-time work years lost annually.
Useful reference points:
Per employee
Per customer
Per day
Per month
% of total
Index versus baseline
Days of work
Cost per transaction
Equivalent headcount
The right reference point makes the message easier to grasp.
17. Use simple text when the number is the message
If you only need to communicate one or two numbers, do not force a chart.
Use large text.
Example:
20%
of customers completed onboarding
Add a short explanation if needed.
Simple text is often better than a pie chart, gauge, or single-bar chart when the message is just one figure.
18. Use tables when users need to look up values
Tables are useful when the audience needs to read individual values.
Use tables for:
Detailed comparison
Operational reporting
Reference values
Financial statements
Ranked lists with several metrics
Improve tables by:
Reducing borders
Using whitespace
Aligning numbers to the right
Aligning decimals
Using clear row and column headers
Highlighting only the important values
If the table is large and pattern recognition matters, use a heatmap.
Heatmaps help users quickly identify high and low values without reading every number.
Always include a clear high-low legend when using heatmaps.
19. Use scatterplots for relationships
Scatterplots are useful when you want to show the relationship between two variables.
Use scatterplots for:
Correlation
Clusters
Outliers
Distribution
Relationship between price and demand
Relationship between effort and impact
You can add:
Reference lines
Average lines
Trend lines
Color highlights
Labels for selected points
Be careful with bubble charts. Size and color can add information, but too many encodings make the chart difficult to understand.
If the audience is not familiar with scatterplots, keep the design simple and use annotations.
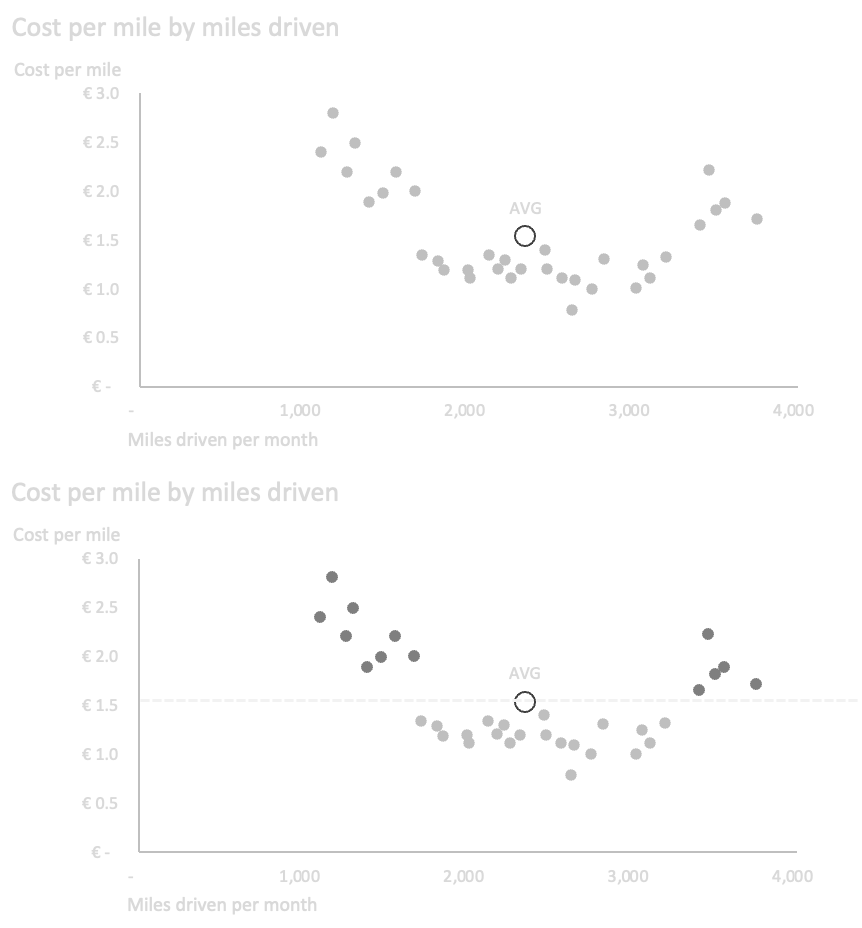
Show the relationship between two measures and lean on guides or highlights so outliers and clusters read quickly.
20. Use line charts for trends over continuous data
Line charts are best for continuous data, especially time.
Use line charts for:
Monthly sales
Daily users
Weekly tickets
Annual revenue
Forecast versus actuals
Avoid line charts for nominal categories because the line implies continuity or sequence.
Good practices:
Keep time intervals consistent.
Use no more than around four main series.
Directly label lines where possible.
Use light gray for context lines.
Highlight the most important line.
Use shaded bands for confidence intervals when relevant.
Differentiate forecasts with dotted lines or visual separation.
If the focus is on individual period values rather than trend, use bars instead.
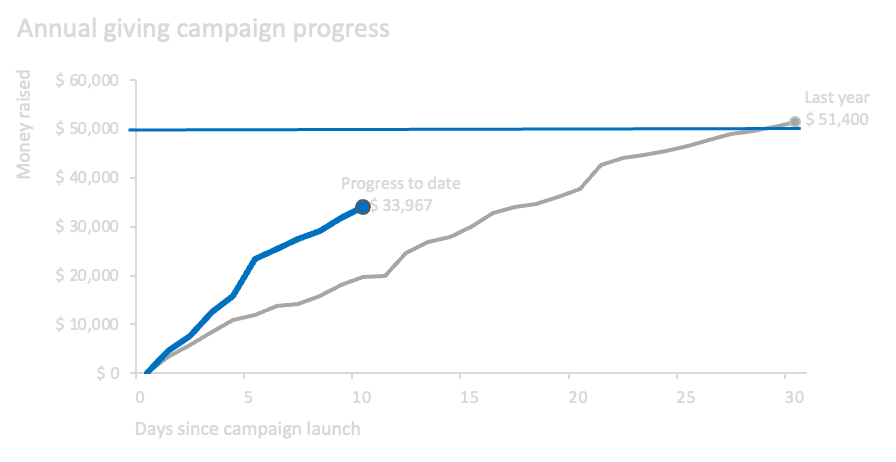
Line labels, deliberate color and weight, and careful axes keep multi-series trends legible without extra chrome.
21. Use slopegraphs for before/after comparisons
Slopegraphs are useful when comparing two points in time or two conditions.
Use them for:
This year vs last year
Before vs after
Current vs target
Pre-campaign vs post-campaign
They show:
Direction of change
Magnitude of change
Relative ranking changes
Avoid slopegraphs when too many lines overlap. Highlight the most important lines and mute the rest.
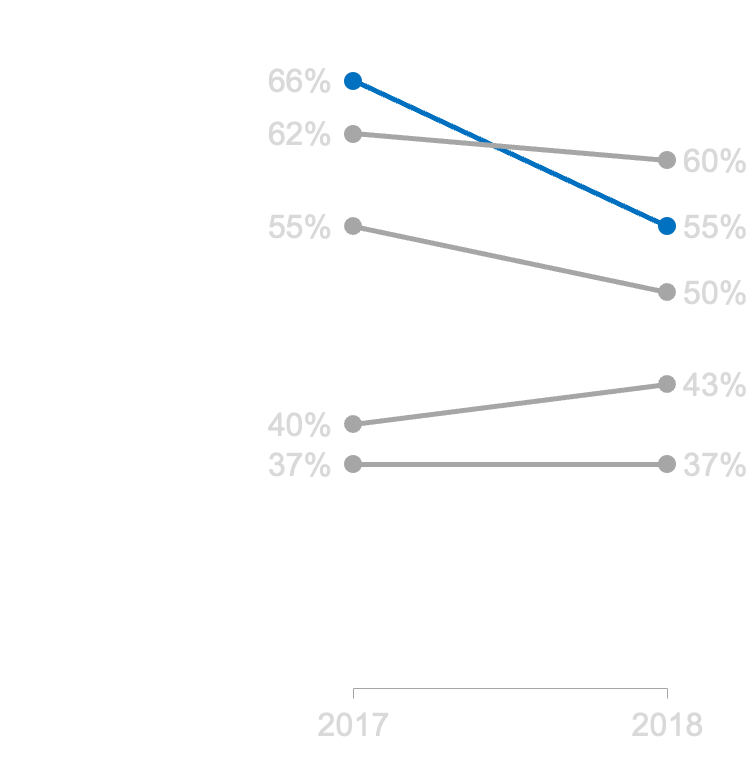
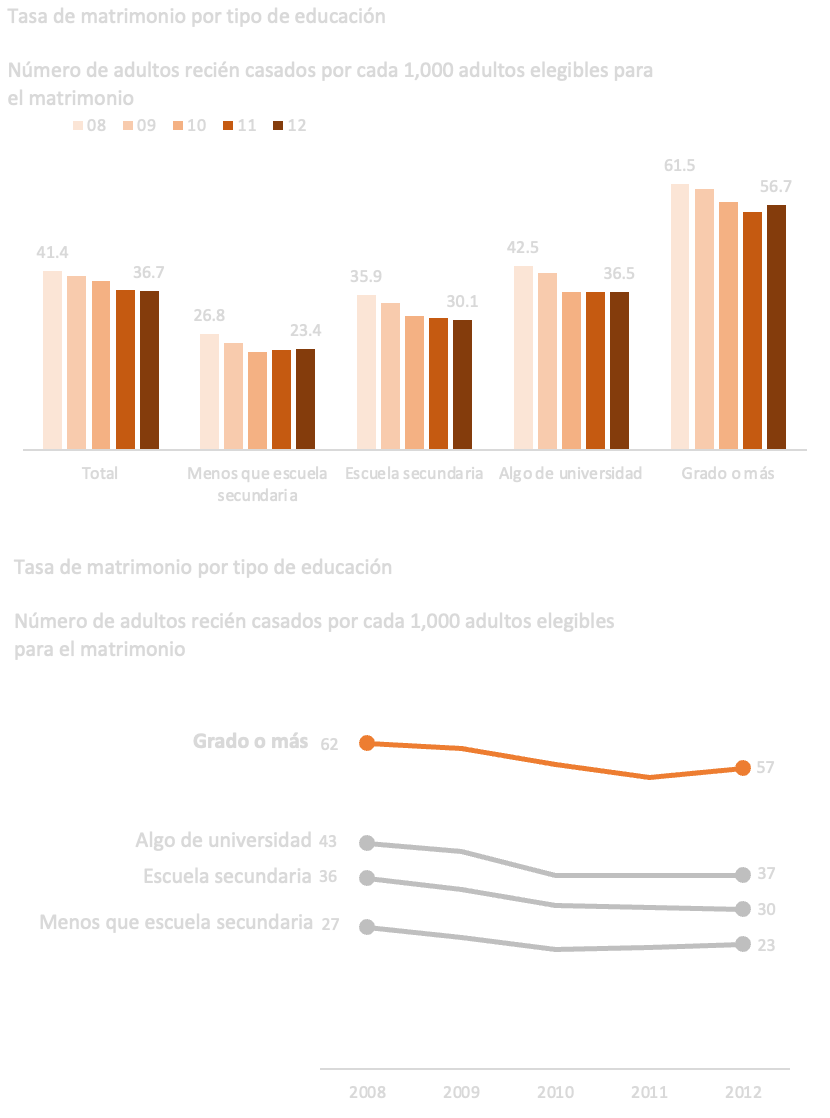
Compare two moments in time and spotlight the category whose slope carries the narrative.
22. Use bar charts for category comparison
Bar charts are one of the clearest chart types because people compare length well.
Use bar charts for:
Sales by product
Customers by segment
Tickets by category
Reasons for churn
Survey responses
Ranking priorities
Best practices:
Start the axis at zero.
Sort categories by value or logical order.
Use horizontal bars for long labels.
Avoid too many categories.
Use direct labels when helpful.
Keep spacing between bars consistent.
Horizontal bars are often better when category names are long or there are many categories.
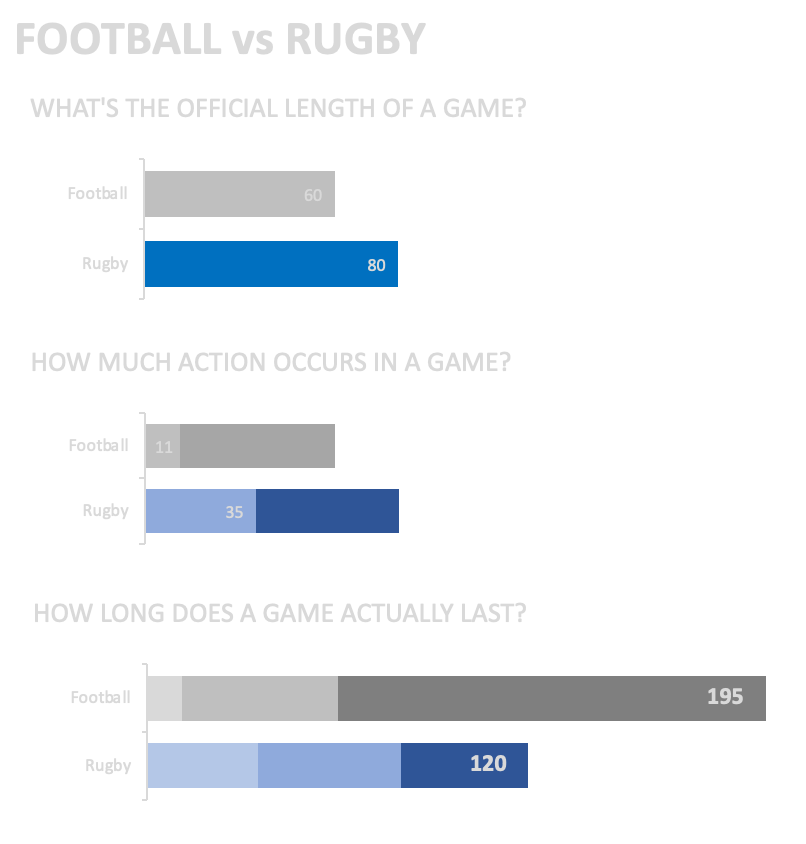
23. Use stacked bars carefully
Stacked bars are useful for showing total plus composition.
Use stacked bars when:
The total matters.
The composition matters.
The number of subcategories is limited.
Be careful: only the bottom segment is easy to compare across bars. Other segments are harder because they do not share the same baseline.
Use 100% stacked bars when the composition matters more than the absolute total.
When using 100% stacked bars, consider adding absolute values separately so the audience understands the size behind the percentages.
For surveys, horizontal 100% stacked bars often work well, especially when responses follow an ordered scale.
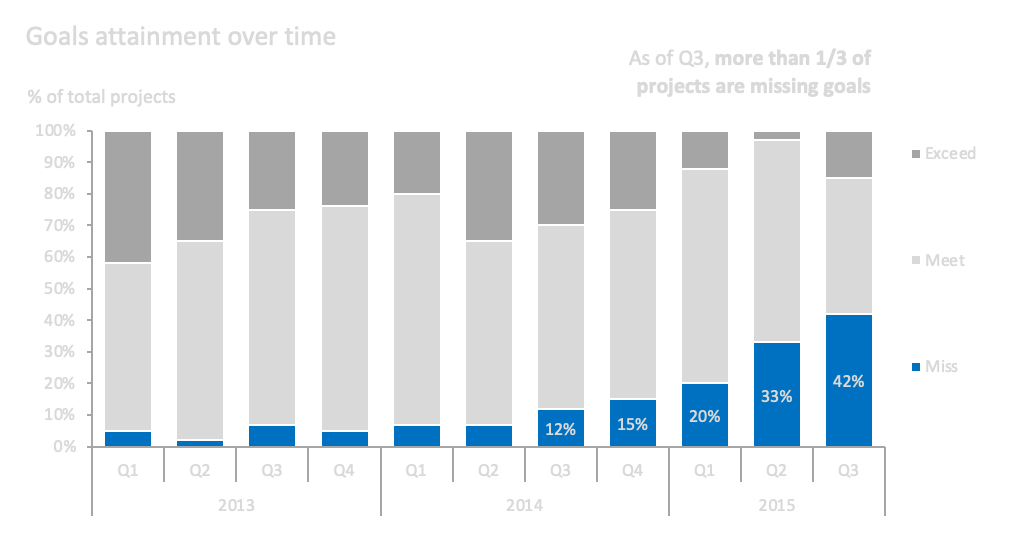
100% stacks compare composition across periodsÔÇöpair them with labels or callouts so viewers track the segments that matter.
24. Use waterfall charts for bridges
Waterfall charts are useful when explaining how a starting value becomes an ending value through positive and negative changes.
Use waterfall charts for:
Budget to actual variance
Revenue bridge
Profit bridge
Headcount movement
Cost increase explanation
Sales objective deviation
They work well when each intermediate driver has a clear additive impact.
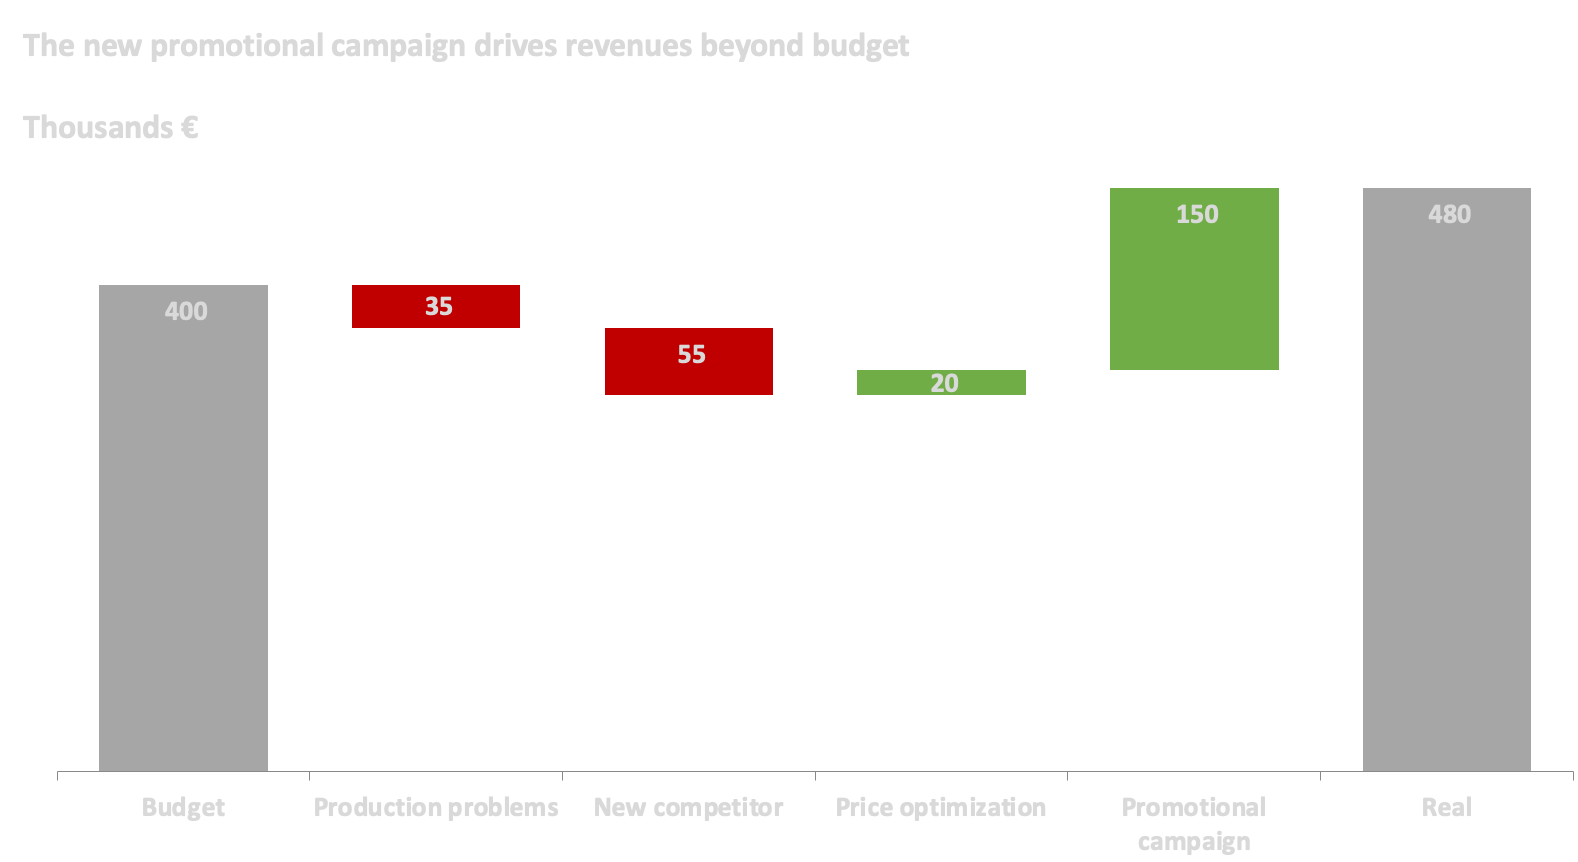
Walk readers from a starting balance through gains and losses to the ending value so each bridge bar tells part of the story.
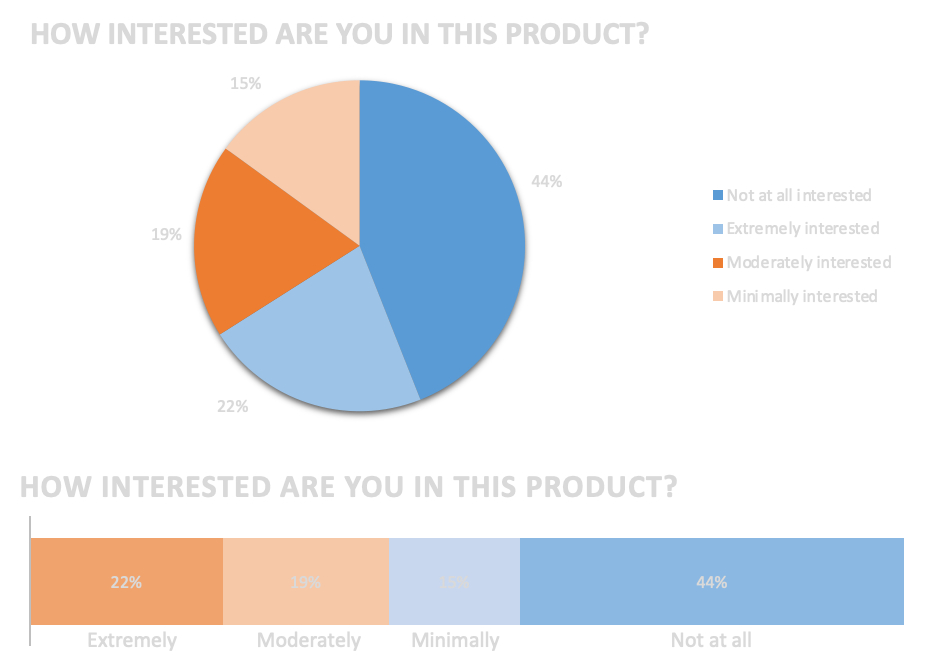
25. Avoid pie charts in most cases
Pie charts are usually harder to read than bar charts because people are not good at comparing angles and areas.
Avoid pie charts when:
There are many categories.
Differences are small.
You need precise comparison.
You want to compare multiple pies.
A pie chart is only acceptable when:
There are very few categories.
The message is about a simple part-of-whole relationship.
The difference is obvious, such as half or quarter.
If you need to compare composition across groups, use a 100% stacked bar chart instead.
26. Use unit charts when individuality matters
Unit charts are useful when each unit represents a person, customer, employee, product, or case.
They work well when the message is about:
Probability
Rarity
Population share
Individual impact
Human outcomes
Example:
Only a small number of high school basketball players reach the NBA.
A unit chart can make that idea more concrete than a pie chart because each dot feels like an individual.
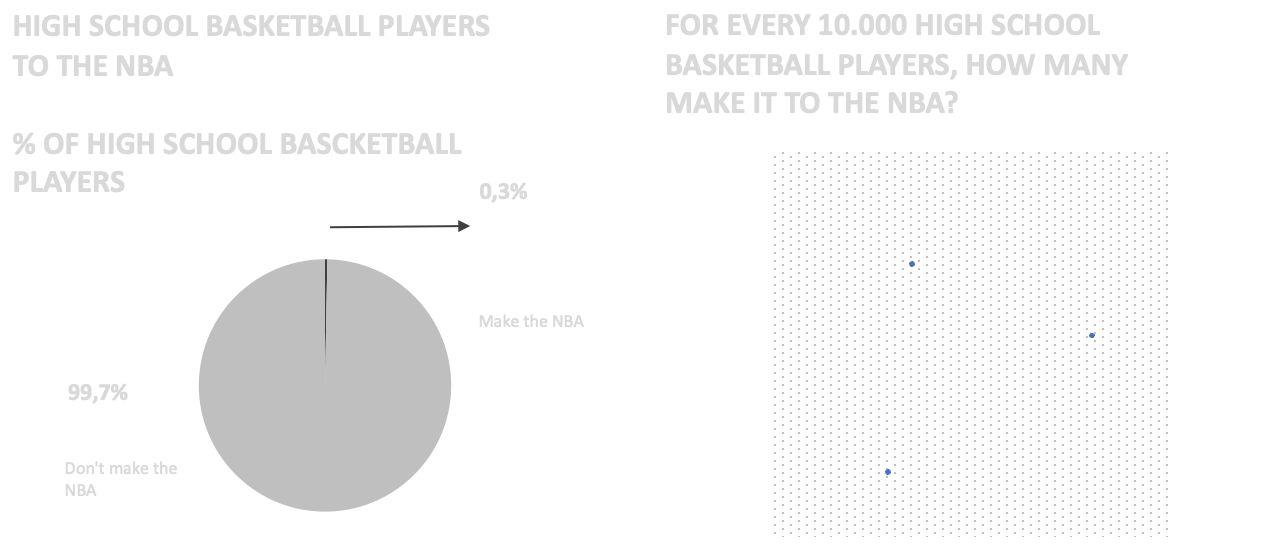
Unit marks preserve individualityÔÇöoften more persuasive than abstract wedge angles for rare outcomes.
27. Use advanced charts only when justified
Advanced charts can be useful, but they require more audience effort.
Examples:
Alluvial diagrams
Network graphs
Boxplots
Marimekko charts
Maps
Sankey diagrams
Unit charts
Use them when:
The audience can understand them.
The data structure requires them.
A simple chart would hide the important pattern.
You have enough space to explain the chart.
Do not use advanced charts just to look sophisticated.
28. Practical chart selection guide
| Goal | Recommended chart |
|---|---|
| Show one number | Simple text |
| Look up detailed values | Table |
| Compare categories | Bar chart |
| Compare long category labels | Horizontal bar chart |
| Show trend over time | Line chart |
| Compare before vs after | Slopegraph |
| Show relationship between two variables | Scatterplot |
| Show distribution / outliers | Scatterplot, boxplot |
| Show part of whole | Bar chart, 100% stacked bar |
| Show change from start to end through drivers | Waterfall |
| Show many individual trajectories | Line chart with muted individual lines |
| Show geographic patterns | Map, only if location matters |
| Show networks or relationships | Network graph |
| Show flow between categories | Sankey / alluvial, only if needed |
29. Final checklist
Before publishing a chart, ask:
Is the main message clear?
Is the chart type appropriate?
Can the audience understand it quickly?
Have I removed unnecessary elements?
Is the title meaningful?
Are colors used consistently?
Is the key point highlighted?
Are axes and scales honest?
Are labels readable?
Is the order meaningful?
Is there enough whitespace?
Is the chart adapted to the medium?
Would a simpler chart work better?
30. Core rules
Start with the message.
Choose the simplest chart that communicates the idea.
Guide attention deliberately.
Use color sparingly and consistently.
Respect chart conventions.
Reduce clutter.
Label directly where possible.
Avoid misleading scales.
Avoid dual axes.
Avoid pie charts unless the case is very simple.
Use more detail in documents and less detail in presentations.
Design for the audience, not for the tool.
[Ad Space — Insert ad script here]
Related
A structured reference on modeling from business processes, declaring grain, avoiding fact-to-fact joins, using semantic layers as the governed interface, and when graphs complement dimensional BI.
Open resourceA structured toolkit of business analytics techniques with ready-to-use Excel templates (PEST, Porter, regression, time series, scenarios, and more) for fast decision support.
Open resourceA structured reference from solution purpose through modeling, security, refresh modes, deployment pipelines, and AI-ready semantic models for Microsoft Power BI and Fabric.
Open resource