Data modeling best practices for the modern analytics stack
[Ad Space — Insert ad script here]
Downloads
Download the Markdown file and attach it (or paste excerpts) in your IDE or agent context so AI assistants can follow these practices when helping with models, DAX, or documentation.
These principles are based on the classic Kimball dimensional modeling techniques, but adapted for today’s environment: cloud columnar warehouses, lakehouse architectures, dbt-style transformation workflows, semantic layers, modern BI tools, AI-assisted analytics, and graph-based relationship analysis. The goal is not to reproduce the original document point by point, but to extract the most useful ideas and translate them into practical guidance for modern data teams.
1. Design around business processes
A good analytical model starts with the business process, not with the source system and not with the dashboard.
Examples of business processes include:
Order placed
Order line sold
Payment received
Subscription renewed
Campaign message sent
Product viewed
Support ticket resolved
Account balance snapshotted
Each important process should usually produce one or more analytical fact tables. This keeps the model aligned with how the business actually works.
Avoid designing core marts directly around source tables such as:
salesforce_opportunity
stripe_charge
ga4_events
hubspot_contacts
shopify_orders
Those source-shaped tables are useful in staging, but the business-facing layer should express business events and entities in a stable, understandable way.
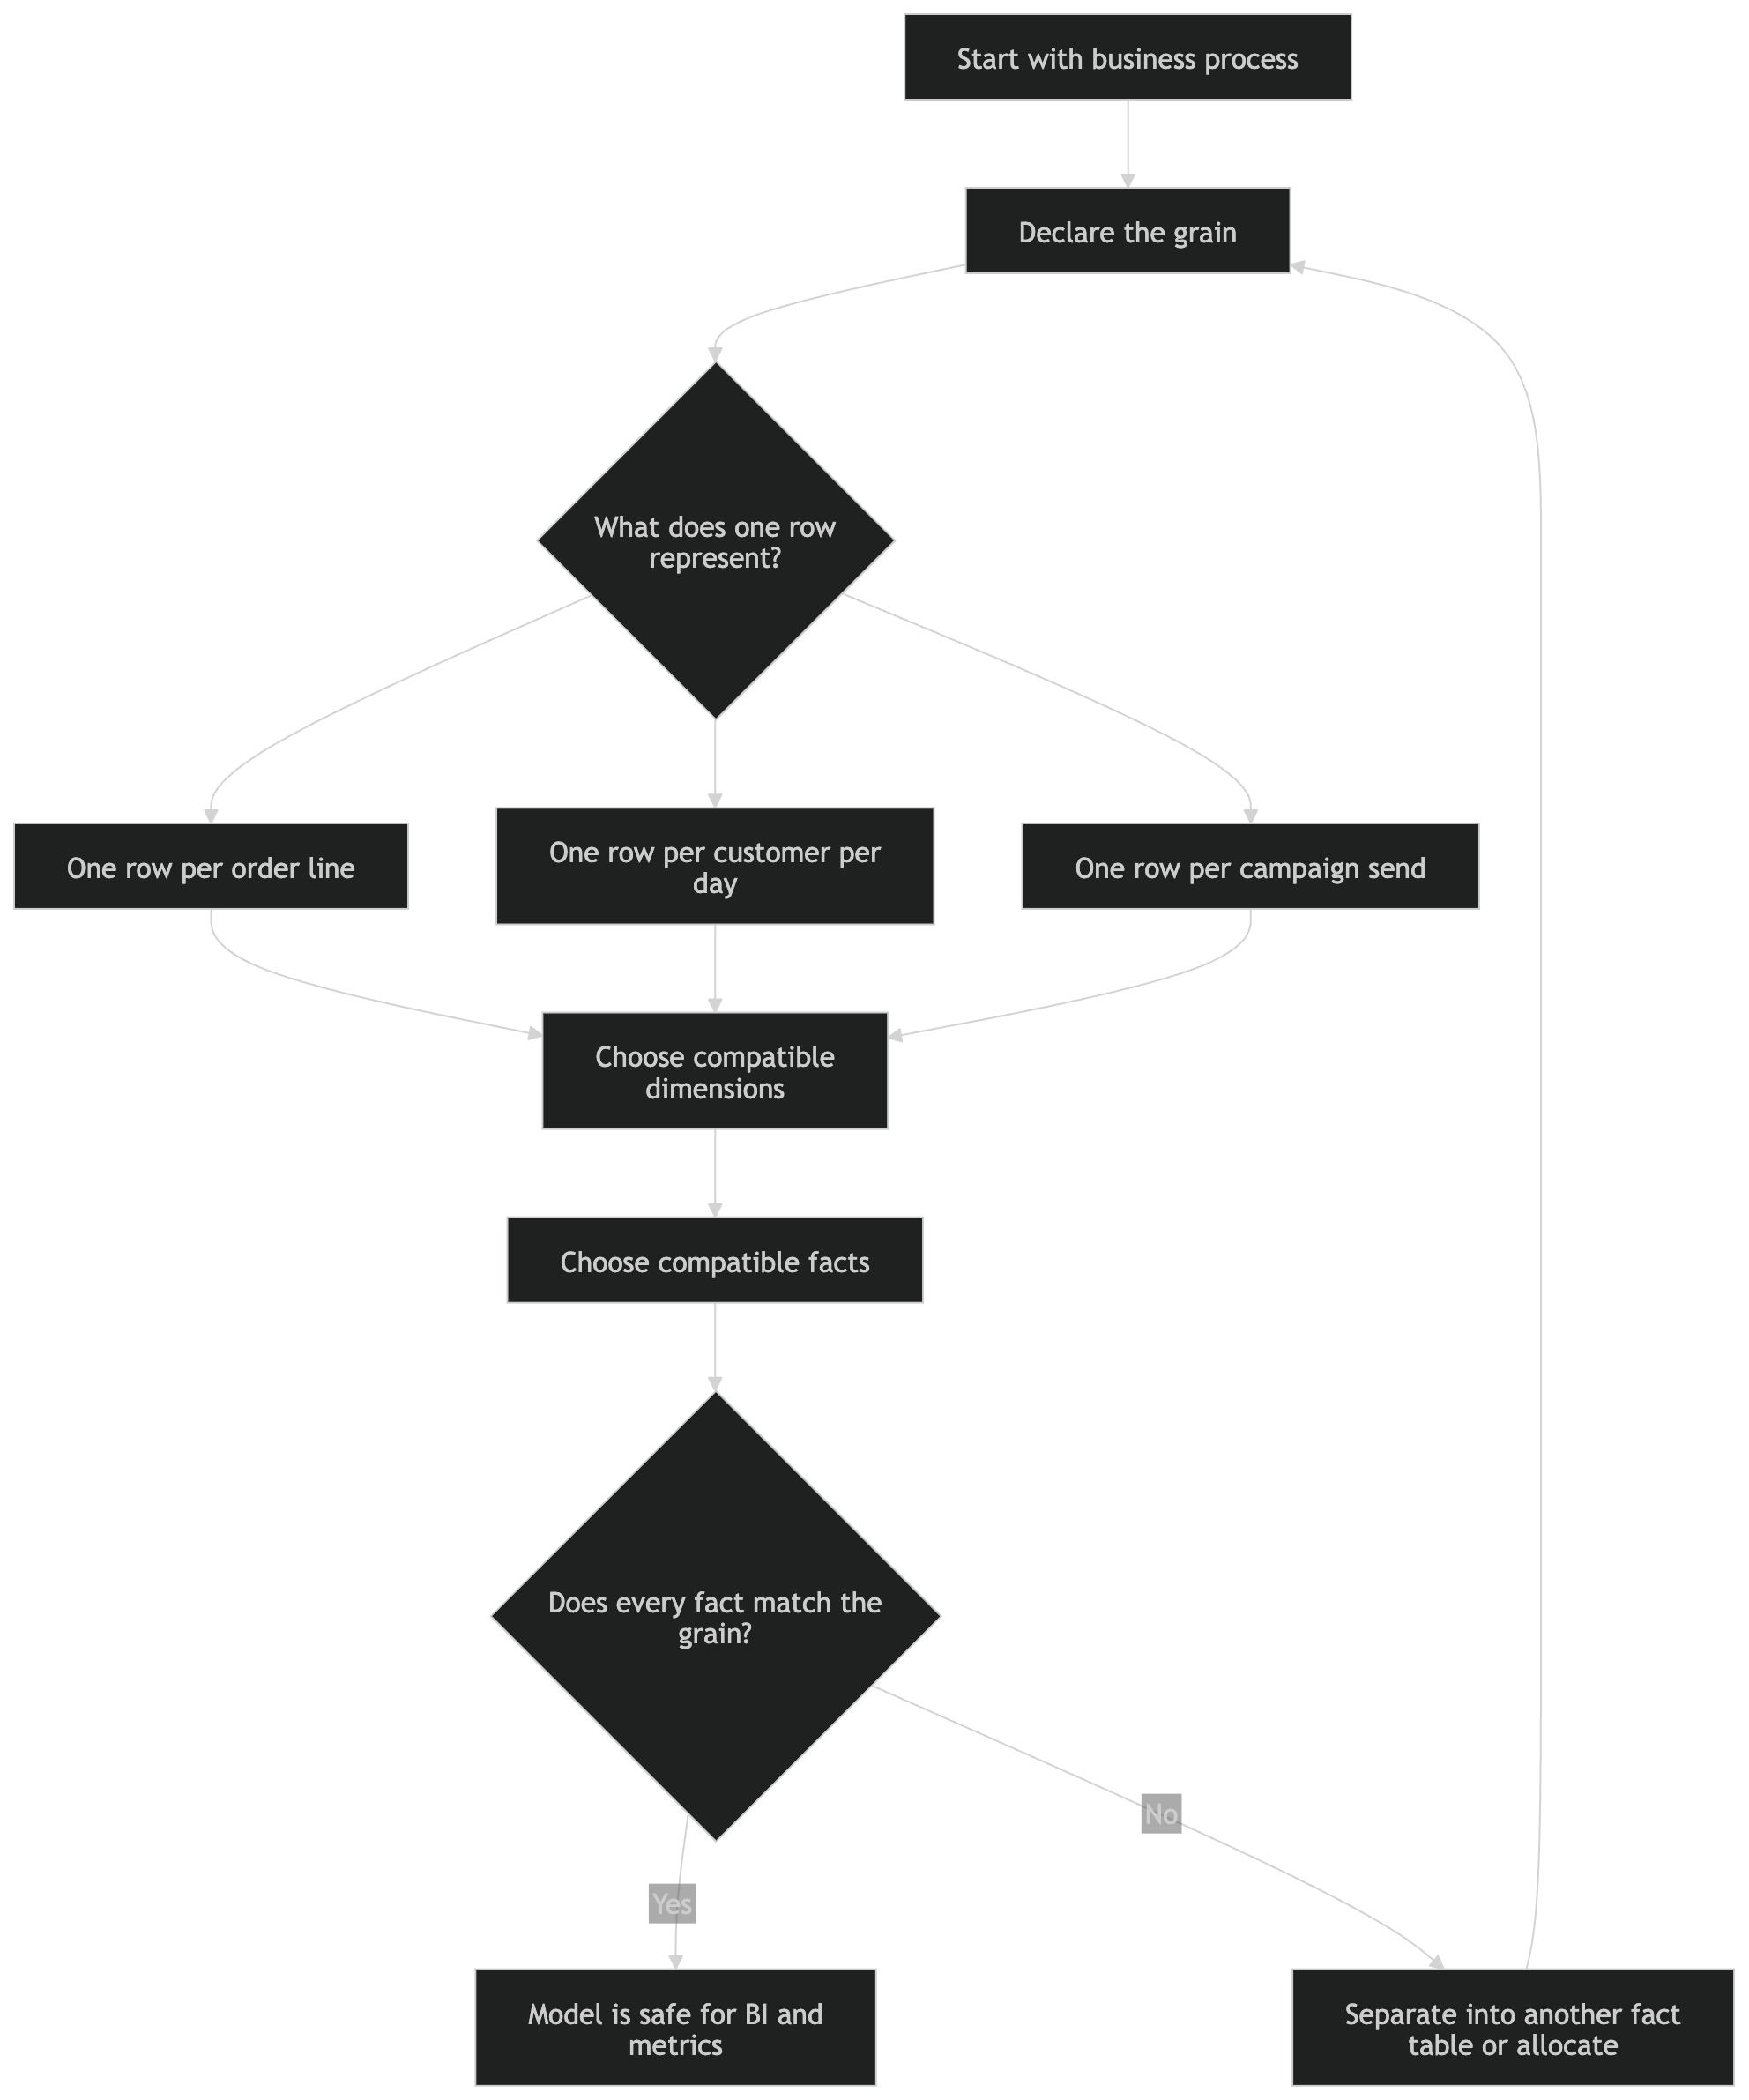
2. Declare the grain before choosing columns
Every fact table needs a clear grain: the exact meaning of one row.
Good grain definitions:
One row per order.
One row per order line.
One row per customer per day.
One row per account per month.
One row per campaign message sent.
One row per product view event.
The grain is the contract of the model. Once it is defined, every fact, dimension, and join must be compatible with it.
Bad pattern:
A table with one row per order line, but also customer-level lifetime revenue.
A table with one row per account per month, but also individual transaction amounts.
A campaign-send table that also contains campaign-level budget without allocation.
Mixed-grain models are one of the fastest ways to create double counting, broken metrics, and confusing BI behavior.
3. Build atomic fact tables first
The foundation should usually be the lowest useful level of analytical detail.
Examples:
fct_order_lines
fct_payments
fct_campaign_sends
fct_product_views
fct_subscription_daily_snapshot
Atomic models are more flexible because they can support many future questions. Aggregates can always be built later; lost detail is harder to recover.
A strong pattern is:
Atomic fact table
→ curated aggregate table
→ governed semantic metric
→ dashboard, report, AI agent, or reverse ETL audience
Do not start by building only dashboard-specific summary tables. They are fast in the short term but become expensive to maintain when the business asks new questions.
4. Separate facts and dimensions clearly
Facts are measurements. Dimensions provide descriptive context.
Facts answer:
How much?
How many?
How long?
How often?
At what value?
Dimensions answer:
Who?
What?
Where?
When?
Why?
How?
Through which channel?
Under which category?
Example fact table:
fct_order_lines
- order_line_key
- order_key
- customer_key
- product_key
- order_date_key
- quantity
- gross_amount
- discount_amount
- net_amount
Example dimensions:
dim_customer
dim_product
dim_date
dim_channel
dim_store
dim_campaign
Modern semantic layers can define measures and dimensions virtually, but the underlying modeling discipline still matters. If the physical model is unclear, the semantic layer often becomes a patch over weak foundations.
5. Classify measures by how they aggregate
Every important measure should be classified as additive, semi-additive, or non-additive.
| Type | Example | Modeling rule |
|---|---|---|
| Additive | revenue, quantity, cost | Can be summed across all dimensions |
| Semi-additive | account balance, inventory level | Can be summed across some dimensions, but not time |
| Non-additive | margin %, conversion rate, average order value | Store components and calculate the ratio later |
For ratios, store the numerator and denominator.
Good:
orders_count
sessions_count
conversion_rate = orders_count / sessions_count
Bad:
Only storing conversion_rate and then averaging it later
This is especially important in BI tools, where users may unknowingly aggregate ratios incorrectly.
6. Use the right type of fact table
There are three core fact table patterns.
Transaction fact tables
Used for individual events.
One row per payment
One row per order line
One row per product view
One row per email send
These are usually sparse: rows exist only when something happened.
Periodic snapshot fact tables
Used for regular state measurement.
One row per account per day
One row per product per warehouse per day
One row per customer per month
One row per subscription per day
These are useful for balances, inventory, pipeline, ARR, active users, and other state-based metrics.
Accumulating snapshot fact tables
Used for processes with a defined lifecycle.
One row per order lifecycle
One row per claim lifecycle
One row per onboarding journey
One row per loan application
These tables usually contain milestone dates and duration metrics.
Example:
order_created_at
payment_received_at
packed_at
shipped_at
delivered_at
cancelled_at
days_to_ship
days_to_deliver
In modern event-driven systems, these lifecycle tables are often derived from immutable event logs rather than updated directly.
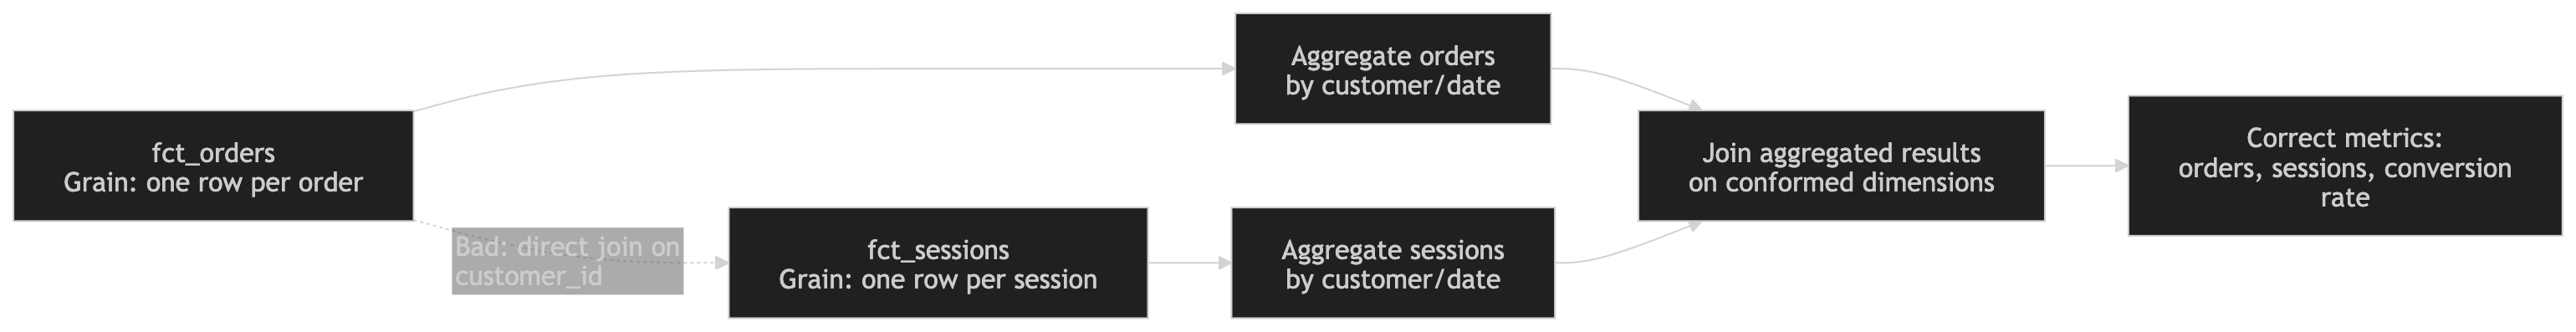
7. Avoid direct fact-to-fact joins
Directly joining two fact tables usually produces incorrect results because each fact table may have a different grain.
Bad:
select
  customer_id,
  sum(order_amount),
count(session_id)
from fct_orders
join fct_sessions using (customer_id)
group by customer_id
This can multiply orders by sessions.
Better:
Aggregate orders by customer/date.
Aggregate sessions by customer/date.
Join the aggregated results on shared dimensions.
This pattern is essential for reliable BI and semantic-layer design.
8. Use conformed dimensions for consistency
Core business entities should be shared across processes.
Common conformed dimensions:
dim_customer
dim_product
dim_account
dim_date
dim_region
dim_channel
dim_campaign
dim_employee
dim_supplier
If Sales, Marketing, Finance, and Product all define “customer” differently, the company will never trust its dashboards.
A conformed dimension provides a shared language across fact tables.
Example:
fct_orders uses dim_customer
fct_campaign_sends uses dim_customer
fct_support_tickets uses dim_customer
fct_subscriptions uses dim_customer
This allows consistent analysis across domains:
Revenue by customer segment
Campaign conversion by customer segment
Support tickets by customer segment
Retention by customer segment
9. Govern metric definitions centrally
Shared facts and metrics need consistent definitions.
Avoid this:
Dashboard A: revenue = order amount
Dashboard B: revenue = paid amount
Dashboard C: revenue = recognized revenue
Dashboard D: revenue = net revenue after refunds
Instead, define different business concepts explicitly:
gross_revenue
net_revenue
booked_revenue
recognized_revenue
invoiced_revenue
collected_revenue
The semantic layer should expose governed metrics, not just raw columns.
A good metric definition should include:
Business definition
Calculation logic
Grain
Allowed dimensions
Filters
Owner
Known exclusions
Freshness expectation
This is also critical for AI analytics. An AI agent should not infer the definition of revenue from raw column names.
10. Make dimensions business-readable
Dimension attributes are what users filter, group, and read in reports. They should be understandable without source-system knowledge.
Poor:
prd_cat_cd = "A13"
cust_typ = "P"
chnl = "03"
Better:
product_category_code = "A13"
product_category_name = "Credit Cards"
customer_type = "Personal Banking"
channel_name = "Mobile App"
Codes can remain in the model, but reports should expose clear labels.
Also avoid null dimension values where possible. Use explicit values such as:
Unknown
Not Applicable
Pending
Unclassified
Other
This improves BI filtering, grouping, and user trust.
11. Use surrogate keys where analytical history matters
Business keys from source systems are not always stable. Customers merge, products are renamed, employees are rehired, accounts migrate, and identifiers change.
A robust dimension usually separates:
customer_sk          -- warehouse surrogate key
customer_id          -- durable business identifier
source_customer_id   -- source system identifier
source_system        -- source name
For modern dbt-style workflows, surrogate keys are often generated as hashes of stable business fields rather than sequential integers.
Example:
customer_sk = hash(customer_id, valid_from)
Use warehouse surrogate keys for joins. Keep natural and source keys for lineage, debugging, and reconciliation.
12. Track history intentionally
Not every dimension attribute needs history. But when history matters, it must be modeled explicitly.
Type 1: overwrite
Use for corrections or attributes where history is not analytically meaningful.
Examples:
Corrected spelling of customer name
Standardized country name
Cleaned product description
Fixed email domain
Type 2: preserve history
Use when users need to analyze facts based on the value that was true at the time.
Examples:
Customer segment
Sales territory
Account owner
Subscription plan
Risk category
Product category
A historical dimension should usually include:
valid_from
valid_to
is_current
This enables “as-was” analysis.
Example:
Revenue by customer segment at the time of purchase
13. Support both “as-was” and “as-is” reporting when needed
Many businesses need two different views of history.
“As-was” asks:
What was the customer segment when the sale happened?
What was the account owner at the time?
What territory owned the account then?
“As-is” asks:
What is historical revenue under the current customer segment?
What is past pipeline under the current sales territory?
What is all-time performance for the current account owner?
The model should make this distinction explicit.
Recommended pattern:
Use historical surrogate key for as-was reporting.
Use durable business key for as-is reporting.
Expose separate BI views or semantic relationships.
Do not expose a single ambiguous field called customer_segment if users need both historical and current views.
14. Use date dimensions for business calendars
SQL date functions are useful, but business calendars often require governed logic.
A proper date dimension should include:
date
day_of_week
week_start_date
month
month_name
quarter
year
fiscal_period
fiscal_year
is_weekend
is_holiday
business_day_number
Use role-playing dates when a fact has multiple date relationships.
Example:
order_date
payment_date
ship_date
delivery_date
cancel_date
Each should be exposed clearly in BI. Users should not have to guess which date a dashboard uses.
15. Flatten stable BI hierarchies
For standard BI analysis, stable hierarchies should usually be flattened into dimensions.
Example product dimension:
product_id
product_name
brand
category
department
business_line
Example geography dimension:
store_id
store_name
city
region
country
market
This makes models easier to query, easier to understand, and easier to expose in BI tools.
Avoid over-normalized BI models where users need to navigate many small lookup tables just to answer basic questions.
16. Use bridge tables for many-to-many relationships
Many-to-many relationships need special care because they can duplicate measures.
Examples:
Account ↔ Customer
Order ↔ Promotion
Patient ↔ Diagnosis
Campaign ↔ Audience
Product ↔ Category
Content ↔ Tag
A bridge table resolves the relationship.
Example:
bridge_account_customer
- account_key
- customer_key
- ownership_percentage
- valid_from
- valid_to
If measures need to be distributed across members, include allocation weights.
Without allocation logic, a metric like account balance or revenue may be counted multiple times.
17. Use graph models for relationship reasoning, not standard BI metrics
Graph models are valuable when the main analytical question is about relationships, paths, networks, and dependencies.
Good graph use cases:
Fraud rings
Customer-household-account networks
Supplier-product-contract-risk relationships
Knowledge graphs for documents and entities
Recommendation relationships
Multi-hop dependency analysis
Standard BI questions usually still belong in dimensional or semantic models.
Examples:
Revenue by month
Orders by product category
Churn by segment
Campaign conversion rate
Inventory by warehouse
A practical architecture is:
Dimensional model for governed metrics.
Semantic layer for business definitions.
Graph projection for relationship-heavy reasoning.
The graph should complement the analytical model, not replace it.
18. Be careful with one big table designs
One big table can be useful for specific dashboards, machine learning features, or performance-optimized use cases. But it should not replace proper modeling.
Risks of one big table:
Mixed grains
Duplicated metrics
Hard-coded business logic
Poor reuse
Difficult maintenance
Ambiguous joins
Expensive rebuilds
A better pattern is to build governed facts and dimensions first, then create wide derived tables only where they serve a clear purpose.
Use one big table as a consumption artifact, not as the core model.
19. Use aggregates for performance, but hide them from users
Aggregates are still useful, especially for:
Large event tables
High-concurrency dashboards
Expensive joins
Embedded analytics
Cost control
Slow semantic queries
Sub-second executive dashboards
But users should not need to choose between:
sales_daily
sales_monthly
sales_quarterly
sales_by_region
sales_by_product
Expose one governed metric, such as net_revenue, and let the BI tool, semantic layer, or query engine use the right aggregate when possible.
Good pattern:
fct_order_lines
agg_revenue_daily_product
agg_revenue_monthly_region
metric: net_revenue
Aggregates should behave like acceleration structures, not separate sources of truth.
20. Separate logical modeling from physical optimization
Logical design is about meaning.
Business process
Grain
Facts
Dimensions
Relationships
Metrics
History
Ownership
Physical design is about execution.
Partitioning
Clustering
Materialization
Incremental loading
Caching
Pre-aggregations
File layout
Query acceleration
Do not distort the business model just to optimize storage or query performance. First create a correct model, then optimize it using the capabilities of the platform.
21. Model data quality and observability
Analytical models should include operational metadata.
Useful fields:
loaded_at
updated_at
source_system
pipeline_run_id
dbt_invocation_id
source_file_name
ingestion_batch_id
record_hash
is_valid
quality_issue_count
For larger platforms, create explicit quality and pipeline monitoring models:
fct_data_quality_events
fct_test_failures
fct_source_freshness_issues
fct_schema_changes
fct_pipeline_runs
This makes the data platform observable, not just usable.
22. Handle late-arriving data deliberately
Late-arriving facts and dimensions are common in modern systems.
Examples:
A transaction arrives before the customer record.
A product event arrives before the product catalog update.
A payment arrives before the subscription state is updated.
A mobile event arrives days late.
A marketing platform sends delayed engagement data.
Best practices:
Use placeholder unknown dimension rows.
Keep source natural keys.
Track unresolved records.
Reprocess or re-key when dimension context arrives.
Document expected data latency.
Expose freshness clearly to users.
Do not silently drop or misclassify records because reference data has not arrived yet.
23. Use semantic layers as the governed interface
The semantic layer should sit between raw analytical models and consumption tools.
It should define:
Entities
Dimensions
Measures
Metrics
Joins
Access rules
Default filters
Time dimensions
Descriptions
Synonyms
The semantic layer is especially important when the same data is consumed by many interfaces:
BI dashboards
Self-service exploration
Embedded analytics
AI agents
Reverse ETL
Notebooks
APIs
Without a semantic layer, metric logic often gets duplicated across dashboards, SQL queries, spreadsheets, and machine learning notebooks.
24. Design models for both humans and AI agents
Modern data models are no longer consumed only by analysts. They are also consumed by AI assistants, text-to-SQL systems, metric APIs, and automated workflows.
This means the model needs rich context.
Good model metadata includes:
Clear table descriptions
Column descriptions
Metric definitions
Join rules
Grain statements
Synonyms
Business examples
Warnings
Data freshness
Owner
Certification status
AI systems perform better when the data model constrains ambiguity. A well-modeled semantic layer is safer than asking an AI system to infer meaning from raw tables.
25. Treat the data model as a product
A modern data model should have ownership, documentation, tests, and a lifecycle.
For each important model, define:
Business owner
Technical owner
Grain
Refresh frequency
Data sources
Key metrics
Known limitations
Downstream dashboards
Quality tests
Access rules
Change process
A model is not finished when the SQL runs. It is finished when the business can understand it, trust it, reuse it, and build decisions on top of it.
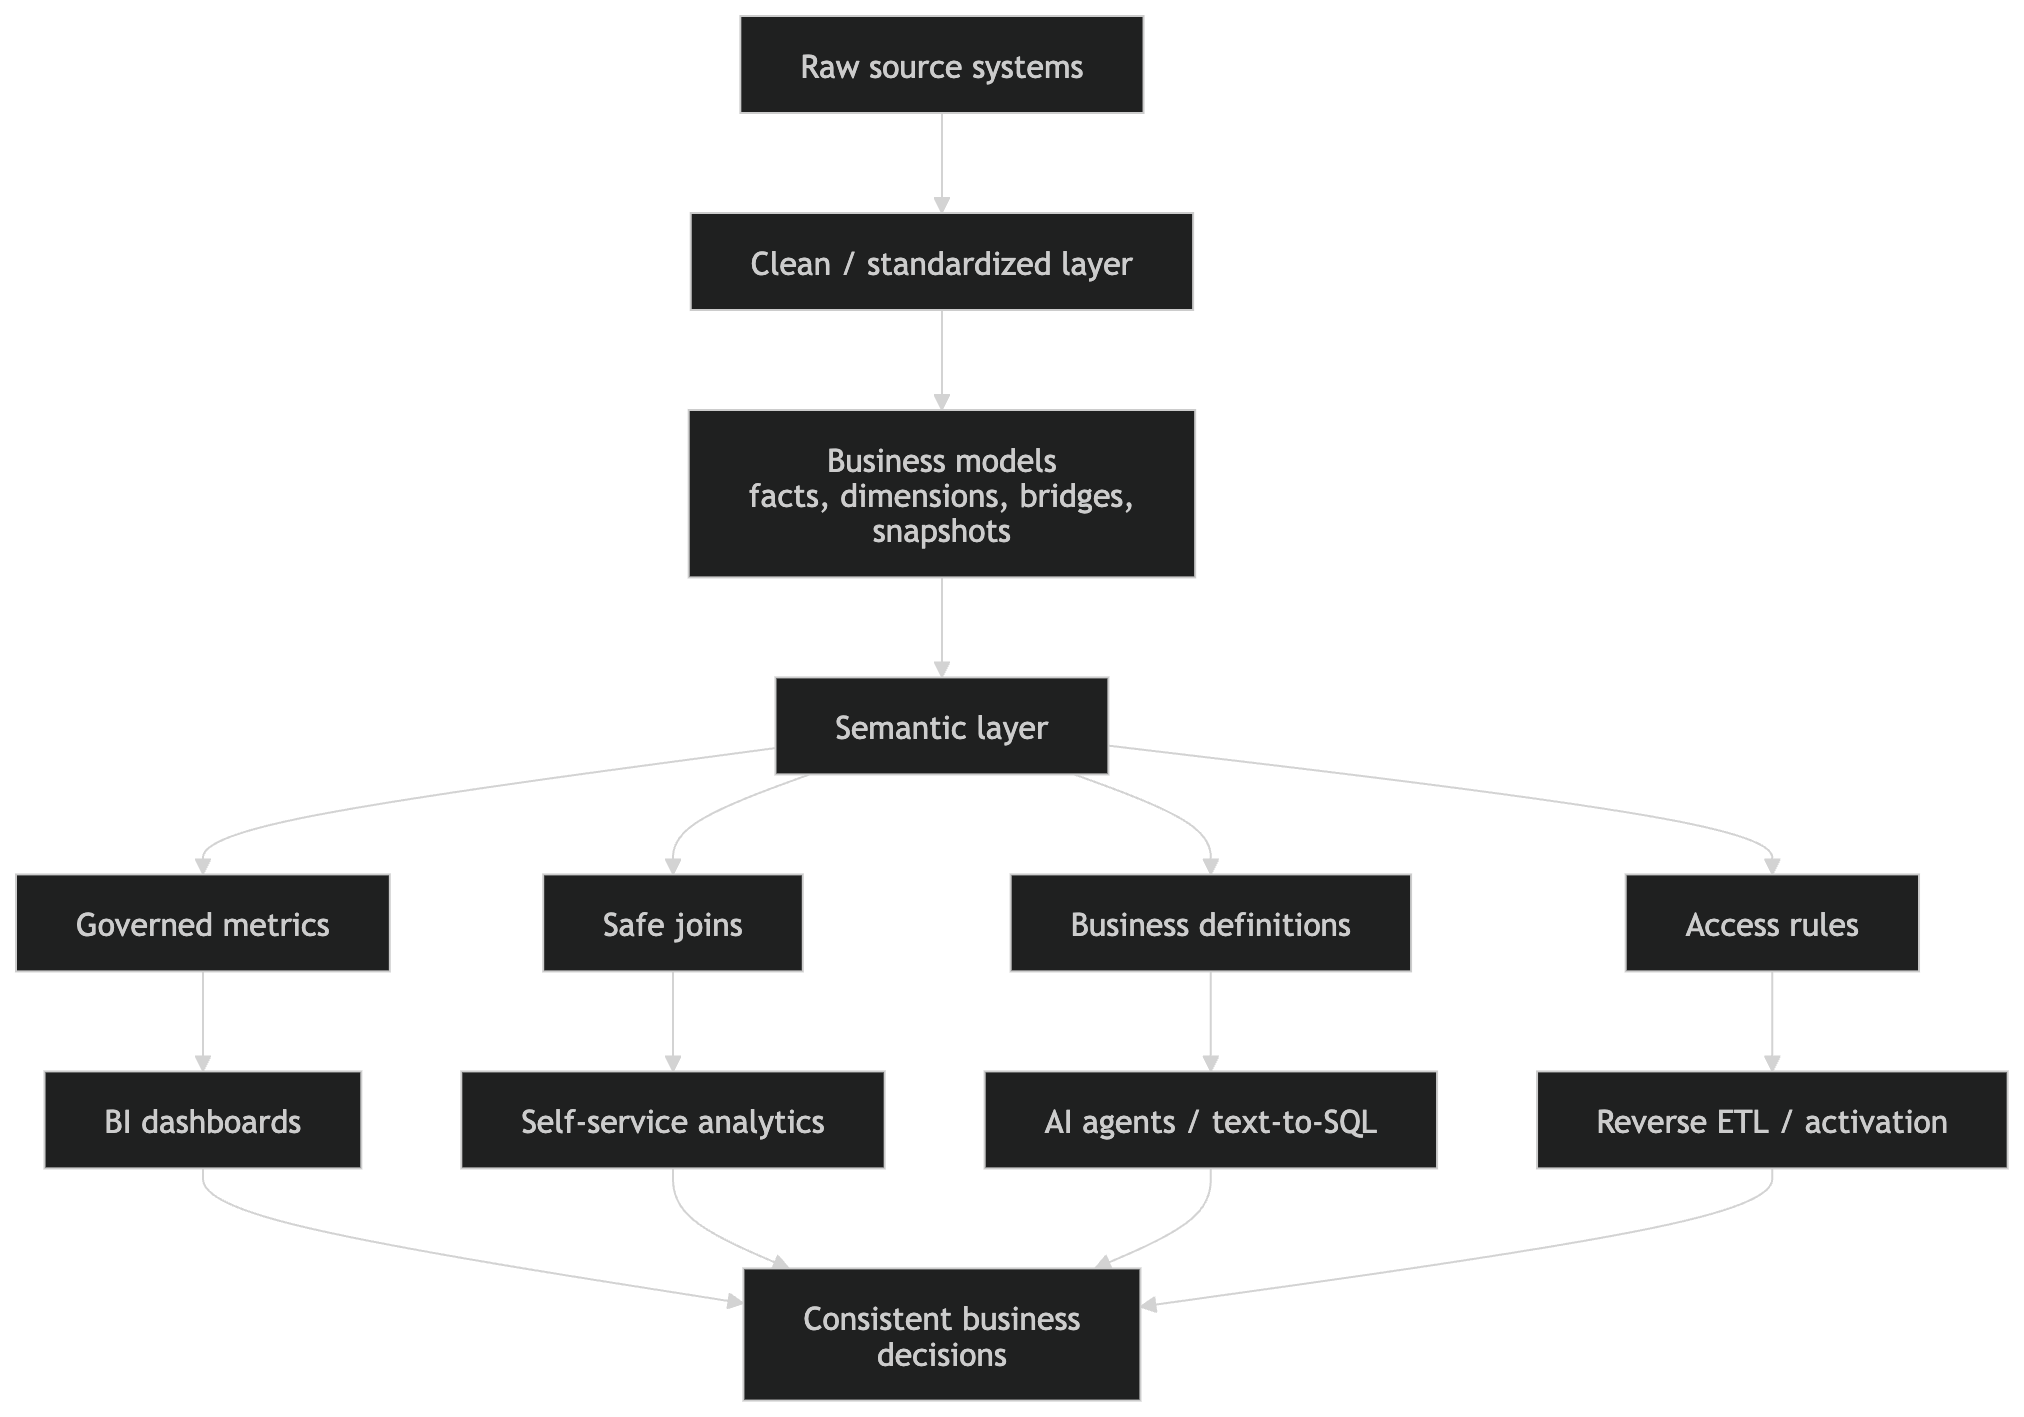
Recommended modern modeling architecture
A practical modern architecture looks like this:
1. Source systems
   CRM, ERP, billing, product analytics, marketing, support, files

2. Raw layer
   Source-shaped, minimally transformed, auditable

3. Clean layer
   Standardized, deduplicated, typed, validated

4. Business layer
   Facts, dimensions, bridges, snapshots, aggregates

5. Semantic layer
   Entities, dimensions, measures, metrics, relationships

6. Consumption layer
   BI, AI agents, reverse ETL, notebooks, embedded analytics

7. Optional graph layer
   Relationship reasoning, entity networks, fraud, dependency analysis, knowledge graph use cases
The business layer should provide stable analytical truth. The semantic layer should provide governed meaning. BI tools should provide usability. Graph models should handle complex relationship reasoning where dimensional joins are not expressive enough.
Practical checklist
Before building a model
What business process does this represent?
Who will use it?
What decisions will it support?
What is the grain?
Which facts belong at that grain?
Which dimensions provide context?
Which source systems are involved?
Before exposing it to BI
Are joins safe?
Are metric definitions clear?
Are dimensions readable?
Are nulls handled properly?
Are many-to-many relationships controlled?
Are date roles clear?
Is history handled correctly?
Before exposing it to AI or self-service
Is the model documented?
Are metrics governed?
Are synonyms and business terms defined?
Are ambiguous columns hidden or renamed?
Are unsafe joins prevented?
Are certified models clearly marked?
Before optimizing performance
Is the model logically correct?
Is the grain clean?
Are users querying too much detail?
Would an aggregate help?
Can the semantic layer route queries automatically?
Is partitioning or clustering appropriate?
Would incremental materialization reduce cost?
Core rules
Model business processes, not source tables.
Declare the grain before choosing facts or dimensions.
Keep facts and dimensions conceptually separate.
Build atomic fact tables first.
Do not mix grains.
Do not directly join fact tables.
Use conformed dimensions for shared entities.
Define important metrics centrally.
Track history intentionally.
Use bridge tables for many-to-many relationships.
Use graph models for relationship reasoning, not ordinary BI metrics.
Use aggregates for performance, not as separate sources of truth.
Document models for humans, BI tools, and AI agents.
Treat the semantic layer as the governed interface.
Treat the data model as a product.
[Ad Space — Insert ad script here]
Related
A structured reference from solution purpose through modeling, security, refresh modes, deployment pipelines, and AI-ready semantic models for Microsoft Power BI and Fabric.
Open resourceSQL is not the bottleneck for most teams; understanding the data is. Why profiling and governed context must come before AI-generated models.
A structured guide to effective data visualizationÔÇödefining the insight before the visual, guiding attention, choosing encodings, and presenting clearly for BI and analytics teams.
Open resource