Beta | work in progress | DuckDB WebAssembly | optional WebLLM | zero uploads
Understand real data before you model it.
Semantic Explorer is a private browser workspace for profiling datasets, validating joins, surfacing quality risks, and packaging structured context for dbt and AI coding assistants.
From raw tables to modeling context
Load your tables
Drop local CSV or Parquet files to initialize source tables in-browser.
Query and analyze
Run profiling, join checks, and quality analysis with SQL, UI controls, or AI guidance.
Explore relationships
Validate coverage, cardinality, fanout, and orphan risks before modeling decisions.
Export context
Download YAML and AI-ready context for implementation workflows.
Exploration modes
UI lane
Select tables, choose columns, add joins, apply aggregations and filters, then inspect results directly.
SQL lane
Write custom SQL for precise investigations and edge cases that need direct control.
Pivot table
Drag fields into rows, columns, filters, and measures to slice and aggregate query results without writing more SQL.
Analysis signals you can trust
Structure and profiling
- Column types, null rates, distinct counts, summary stats
- Value length and shape patterns
- Schema-level relationship hints
Join behavior and safety
- Likely join suggestions across tables
- Composite key join candidates when enabled
- Cardinality and coverage analysis
- Fanout and orphan row detection
Quality and normalization
- Duplicate and null concentration hotspots
- Type mismatch and inconsistency checks
- Column anomaly detection for outliers and format issues
- Cleaning and normalization recommendations
Context package output
What you save from exploration
- YAML snapshots of automatic analysis: profiling, joins, quality signals, and schema understanding
- Saved explorations with optional comments, packaged in the same YAML workflow
- Recommended joins and findings you promote while exploring
- Structured YAML you can diff, archive, or feed into downstream tooling
What you export for implementation
- YAML with the complete automated analysis (profiling, joins, anomalies, warnings, and related output)
- YAML with your saved explorations, queries, and notes
context.mdthat summarizes the package for assistants (generate before download)- No dbt source or schema YAML is emitted; use the YAML and summary as evidence for modeling work in dbt or elsewhere
Privacy and local execution
DuckDB runs locally in your browser using WebAssembly. Optional AI assistance can run locally with WebLLM. No raw dataset upload is required for core exploration workflows.
This architecture is practical for sensitive and regulated environments. You can inspect browser network activity directly while using the tool.
Why this improves AI-assisted modeling
Assistants fail when prompts contain only table names and light metadata. Semantic Explorer builds a stronger context layer: validated joins, profiling evidence, quality risks, exploration notes, and YAML plus summaries you can use with dbt or other stacks.
Instead of guessing transformations, assistants receive concrete signals about relationship behavior, testing priorities, and modeling constraints. That produces safer model design with faster iteration cycles.
Profiling, join checks, coverage, and many quality signals run deterministically in your browser on the actual tables. You get repeatable evidence without asking a remote model to re-derive the same validations, so you avoid shipping raw data to an LLM just to rediscover what a local pass already proved.
Instructions
Before starting, check the Privacy badge in the upper-left corner to see how your data stays local. You can confirm this by disconnecting from the internet after the data has loaded.
1. Upload local files and choose the analysis mode
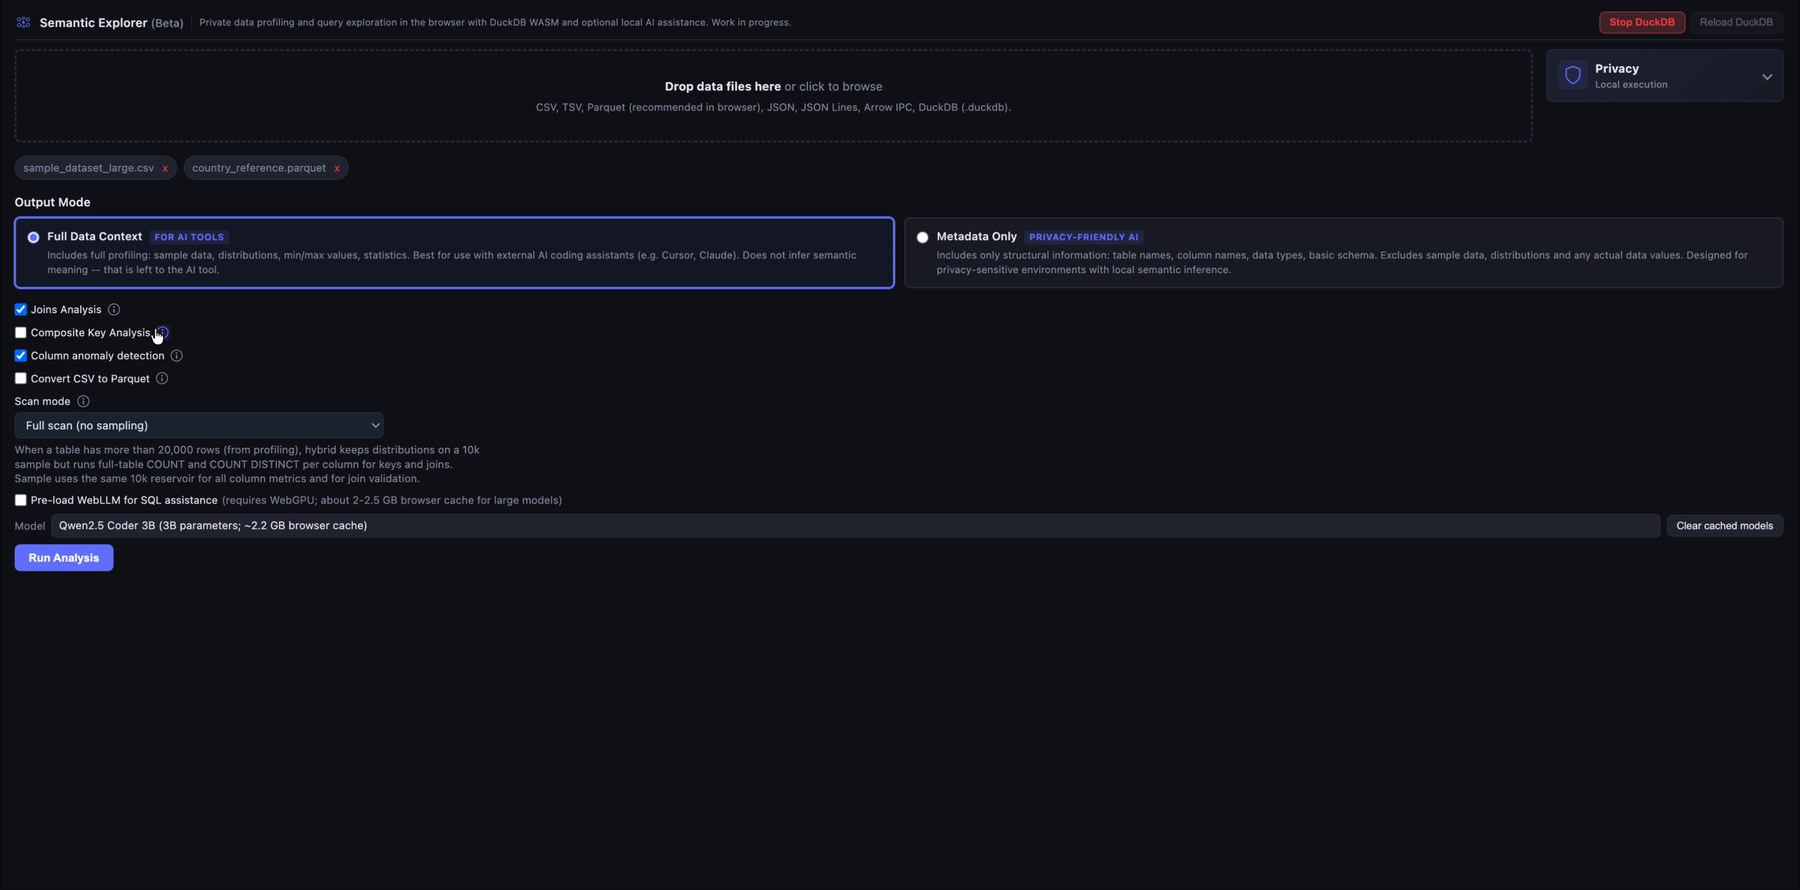
Start by dropping one or more local data files into Semantic Explorer. The app supports common analytical formats such as CSV, TSV, Parquet, JSON/NDJSON, Arrow IPC, DuckDB files, and SQLite databases.
Before running the analysis, choose the output depending on what you want in the AI context files you can download: a full data context for AI-assisted development, or a lighter metadata-only export for privacy-sensitive use cases. AI context files are meant for use with coding assistants such as Cursor or Claude Code on data transformation and modeling tasks (for example, when working with dbt).
In the analysis configuration you have several options:
- Join Analysis: Several candidate primary and foreign keys are identified from column names, cardinality, data types, and related signals. Join candidates are then identified, ranked by match quality, and the best joins are tested. Based on several rules, joins are promoted to the query editor and safety warnings highlight orphan handling, fanout, and similar risks. Use this when you load more than one table and are not sure which joins to apply.
- Composite Key Analysis: After single-column join validation, this option runs an extra pass that proposes two-column (composite) joins when heuristics suggest a composite key (several foreign-key-like columns, weak single-column links, or fanout warnings). Each candidate is validated with SQL using
ANDequality on both columns. This option is more memory-intensive, especially with many large tables. Not recommended by default. - Column anomaly detection: This analysis extends the default profiling and flags possible outliers, format mismatches, high null concentration, and similar issues. It is resource-intensive and can slow the analysis run. If you leave it off, you can still run anomaly detection on individual columns in the Query Explorer.
- Convert CSV to Parquet: Strongly recommended for large CSV uploads; it speeds up automated analysis and your queries.
- Pre-load WebLLM: When checked, the Qwen 2.5 Coder model is loaded via WebLLM (runs entirely in the browser, so no data is sent to a server). For now it is only used to help fix queries after an error. This is experimental and uses a large share of browser memory (not recommended by default).
2. Run automatic profiling
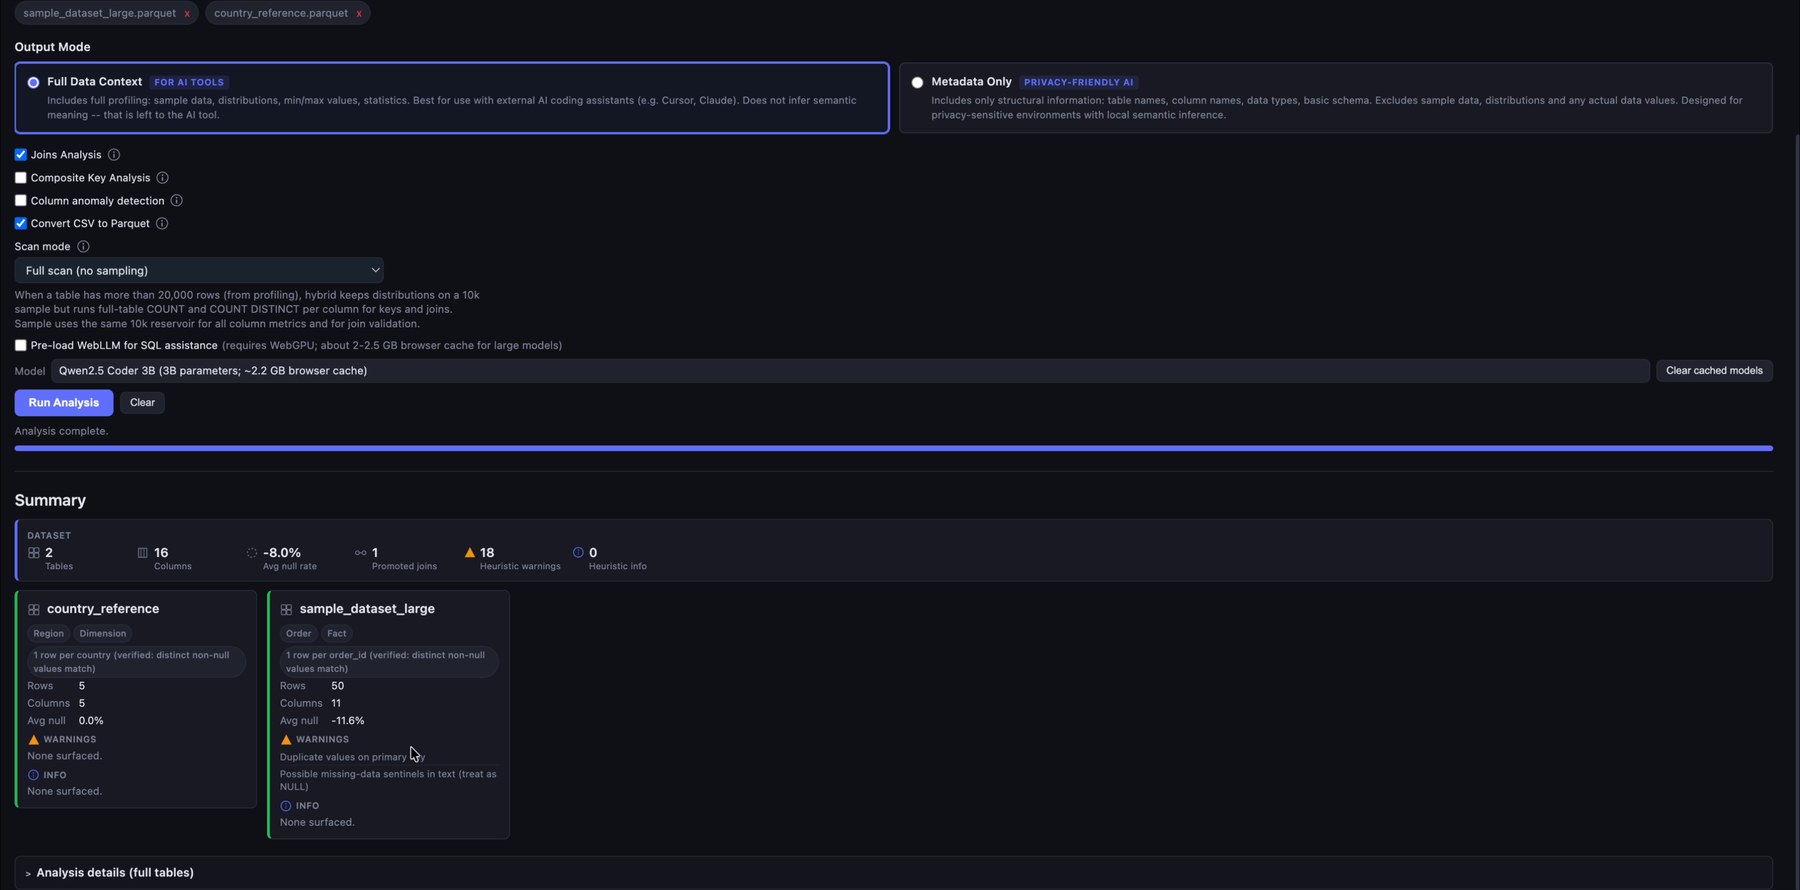
After the files are loaded, Semantic Explorer profiles the datasets directly in the browser. It summarizes row counts, column counts, null behavior, warnings, candidate keys, and recommended joins. This gives you a fast first read of the structure and quality of the raw data before writing any transformations.
Review the analysis summary and the full analysis tables below.
The Clear button removes all analysis results. You can add more files and re-run the analysis at any time (each run starts from scratch).
3. Explore fields, data types, and suggested joins
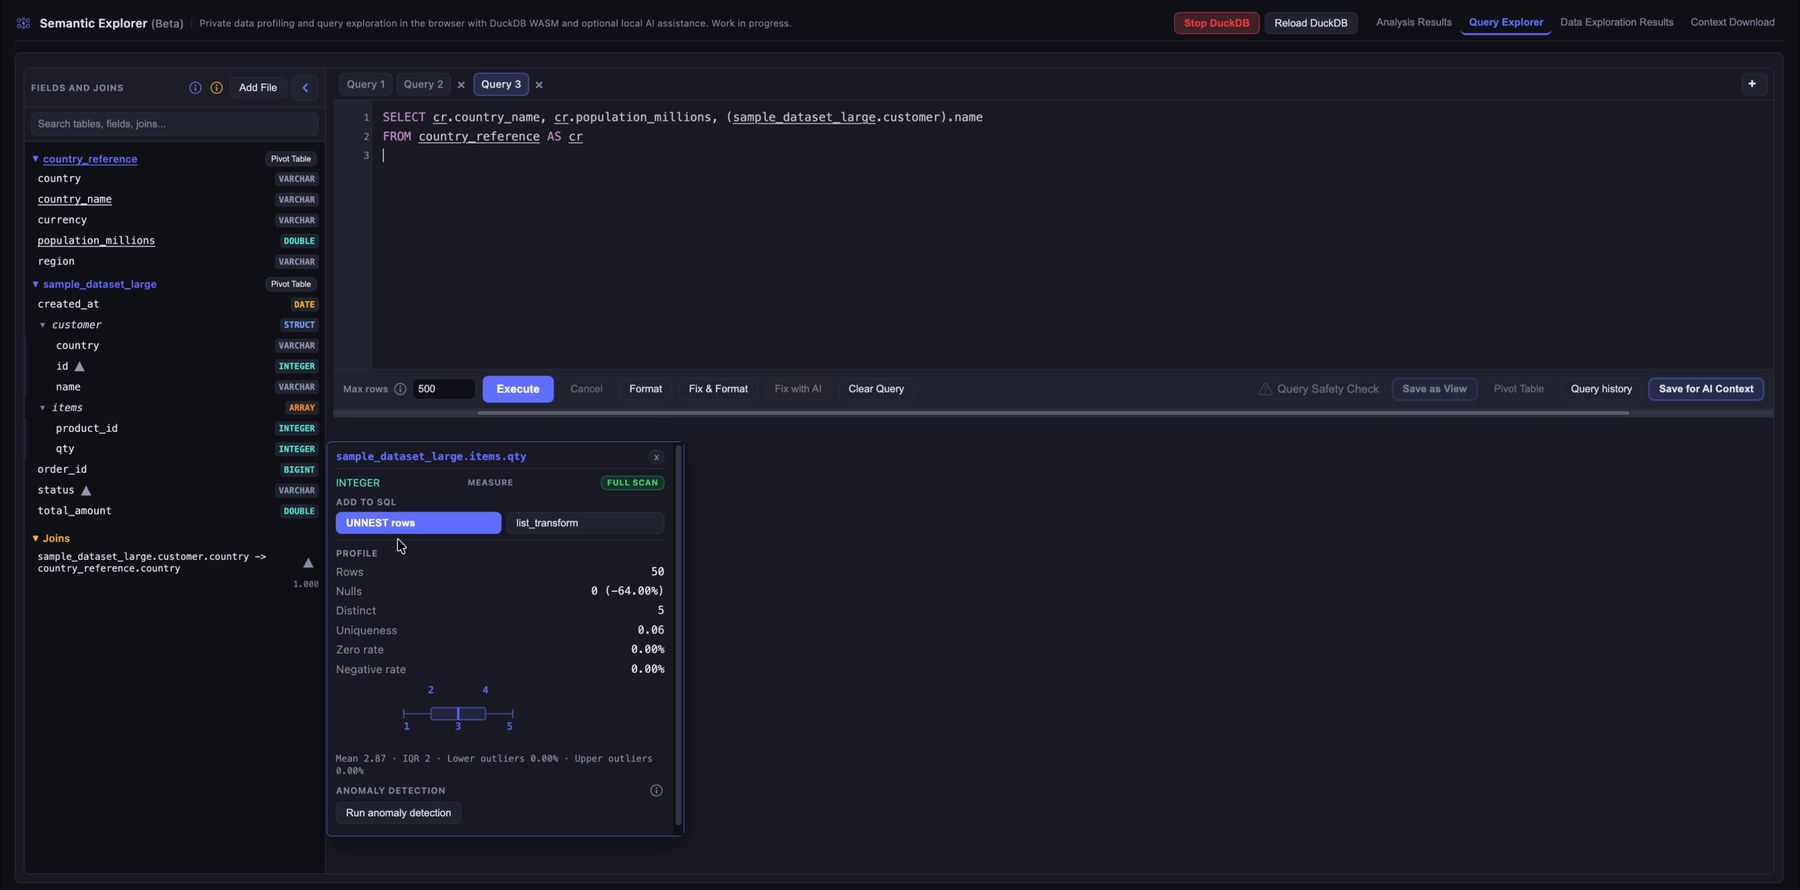
Open the Query Explorer to inspect the available tables and columns. The left sidebar lists fields, detected data types, promoted joins, and saved views (after you run a query, you can save it as a view with Save as View).
When you hover over a table, you see summary information and can click Explore to run a quick SELECT *. When you hover over a column, profiling details help you understand the underlying values. The profiling panel adapts to the column type. Below it you may see notes or warnings from the analysis pass, and anomalies if you ran anomaly detection. Information, warnings, and anomalies include quick SQL actions that insert snippets into the editor. Each column also has quick-action buttons to add the column to the query, with or without aggregations.
STRUCT and ARRAY columns are unnested automatically and behave like ordinary columns, with some limits on profiling and join validation.
When you hover over a join, you see validation results and any warnings. Click the join to insert it into the query editor.
4. Write and execute SQL queries
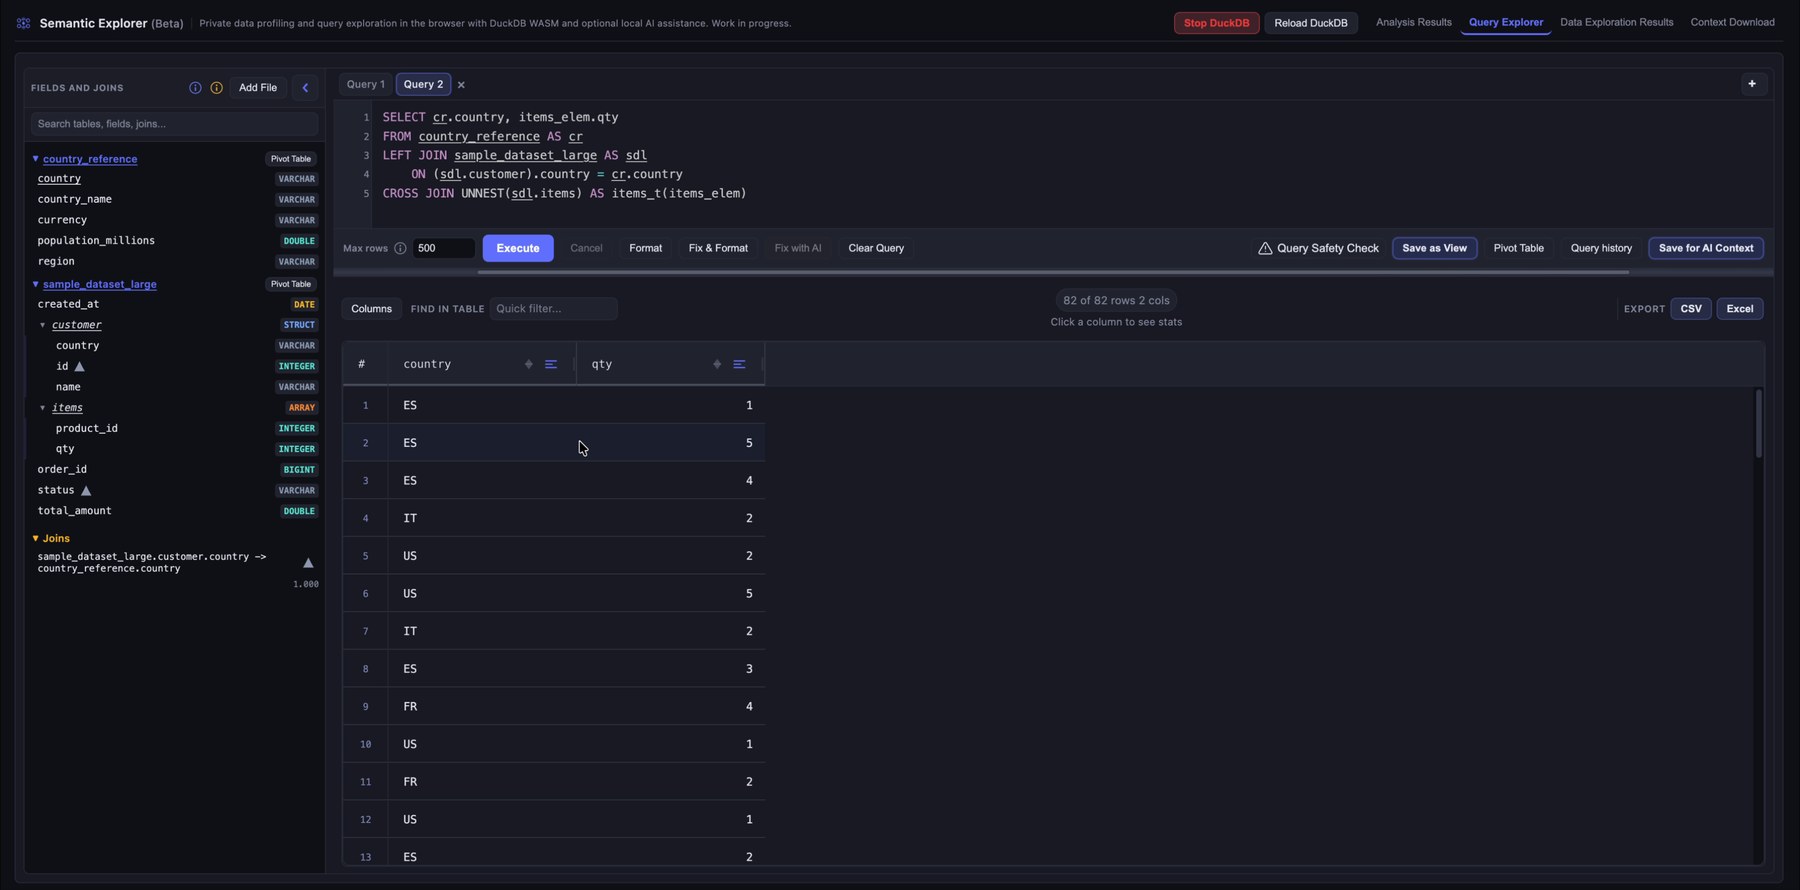
Use the SQL editor to query the loaded data with DuckDB. The interface supports multiple query tabs, row limits, formatting, autocomplete, and result previews. This lets you validate relationships, inspect rows, and test transformation logic locally.
A default cap of 500 rows applies. You can change it or set 0 for unlimited rows, although returning more than a few thousand rows in the grid is usually impractical (the engine can still handle much larger scans).
One especially useful control is Fix & Format. It reads the current editor text, fixes the query, consolidates table aliases, adds any required GROUP BY columns, and inserts the joins it selects. Join selection is deterministic: it picks the best combination from the recommended joins using fanout, quality score, and join count. You can select columns from several tables and run Fix & Format to get a clean query with suggested joins (always review joins; recommendations are not guaranteed to be correct).
5. Get feedback when a query fails
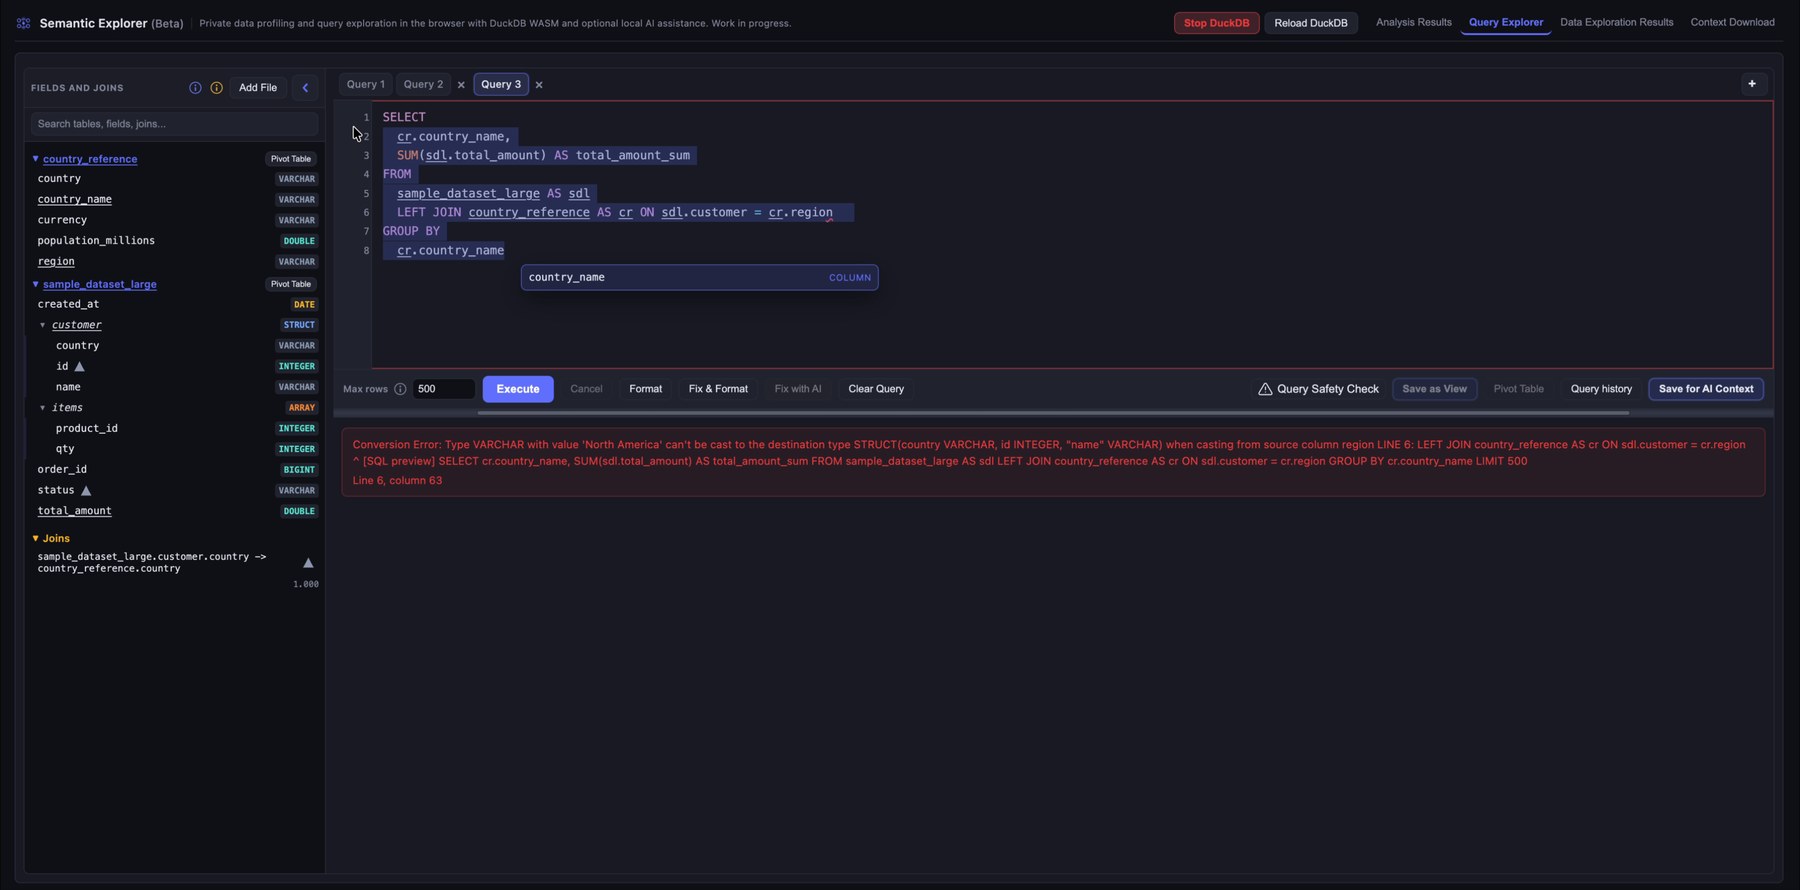
When a query fails, Semantic Explorer shows the database error directly below the editor. That makes it easier to spot invalid references, type mismatches, or bad join conditions while you iterate. If you pre-loaded the WebLLM model, use Fix with AI to attempt a fix using the error text and table metadata.
6. Detect risky joins and query health issues
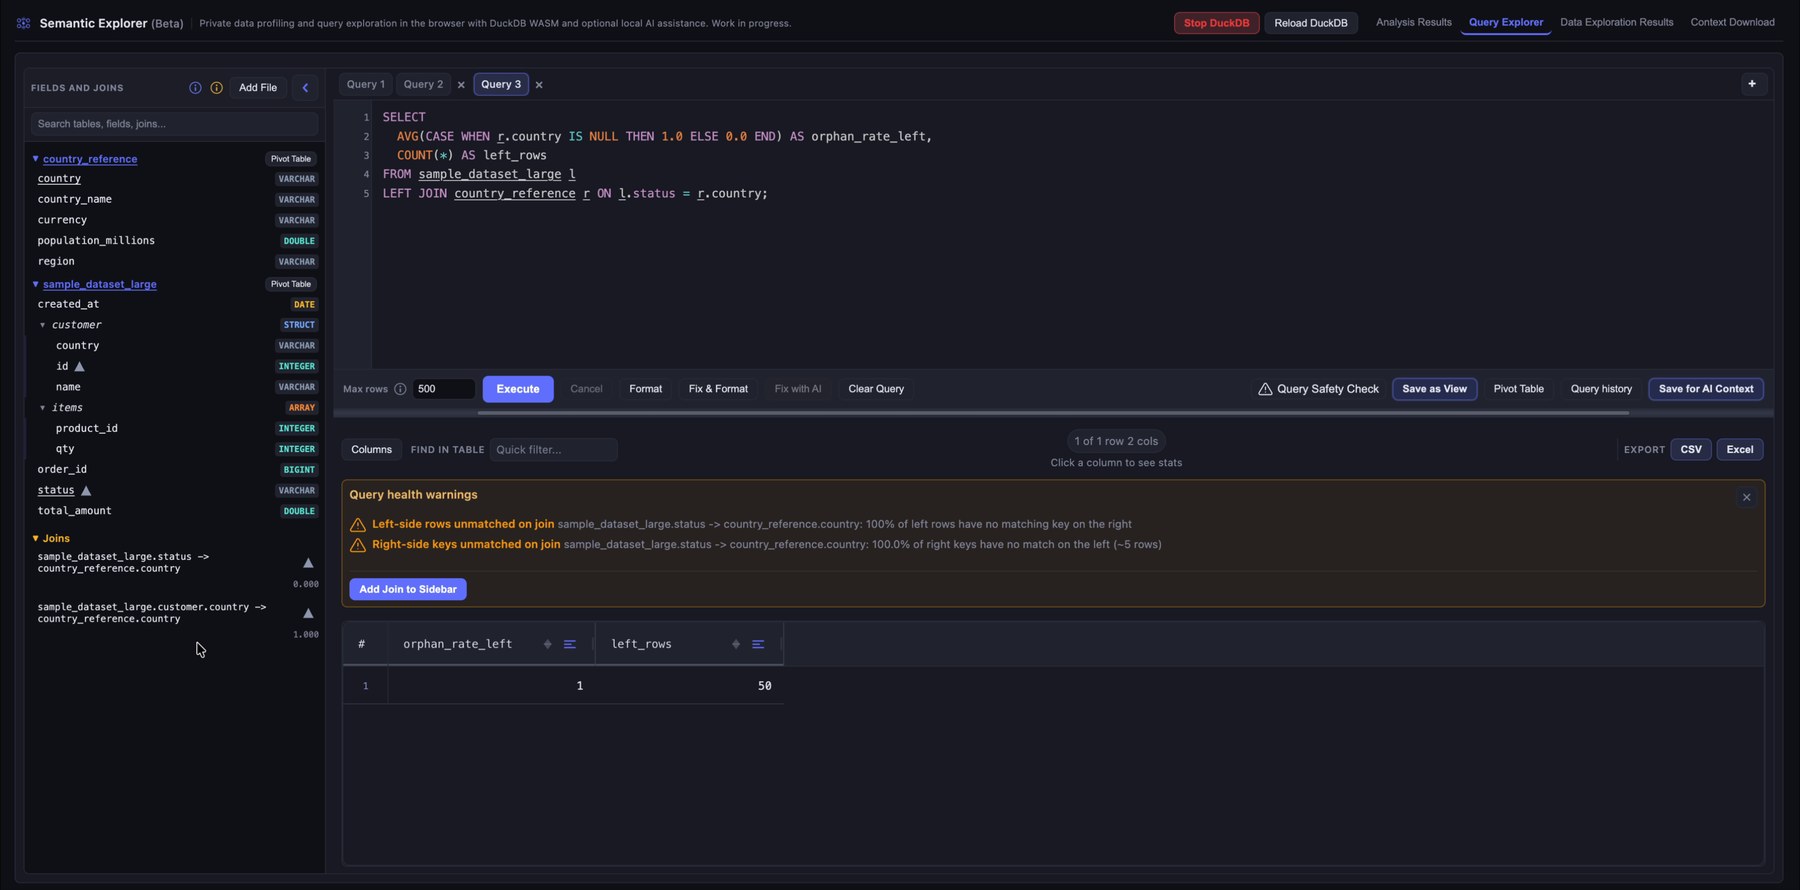
If you skipped Join Analysis in configuration, or you want to try joins that were not promoted, you can still assess safety and add joins from the sidebar.
Click Query Safety Check to surface warnings about potentially unsafe joins, such as unmatched keys or relationships that could skew results. That helps you avoid orphan rows, unexpected fanout, or joins that silently drop rows.
To remove a join from the sidebar, hover it and choose Remove join.
7. Review joined query results
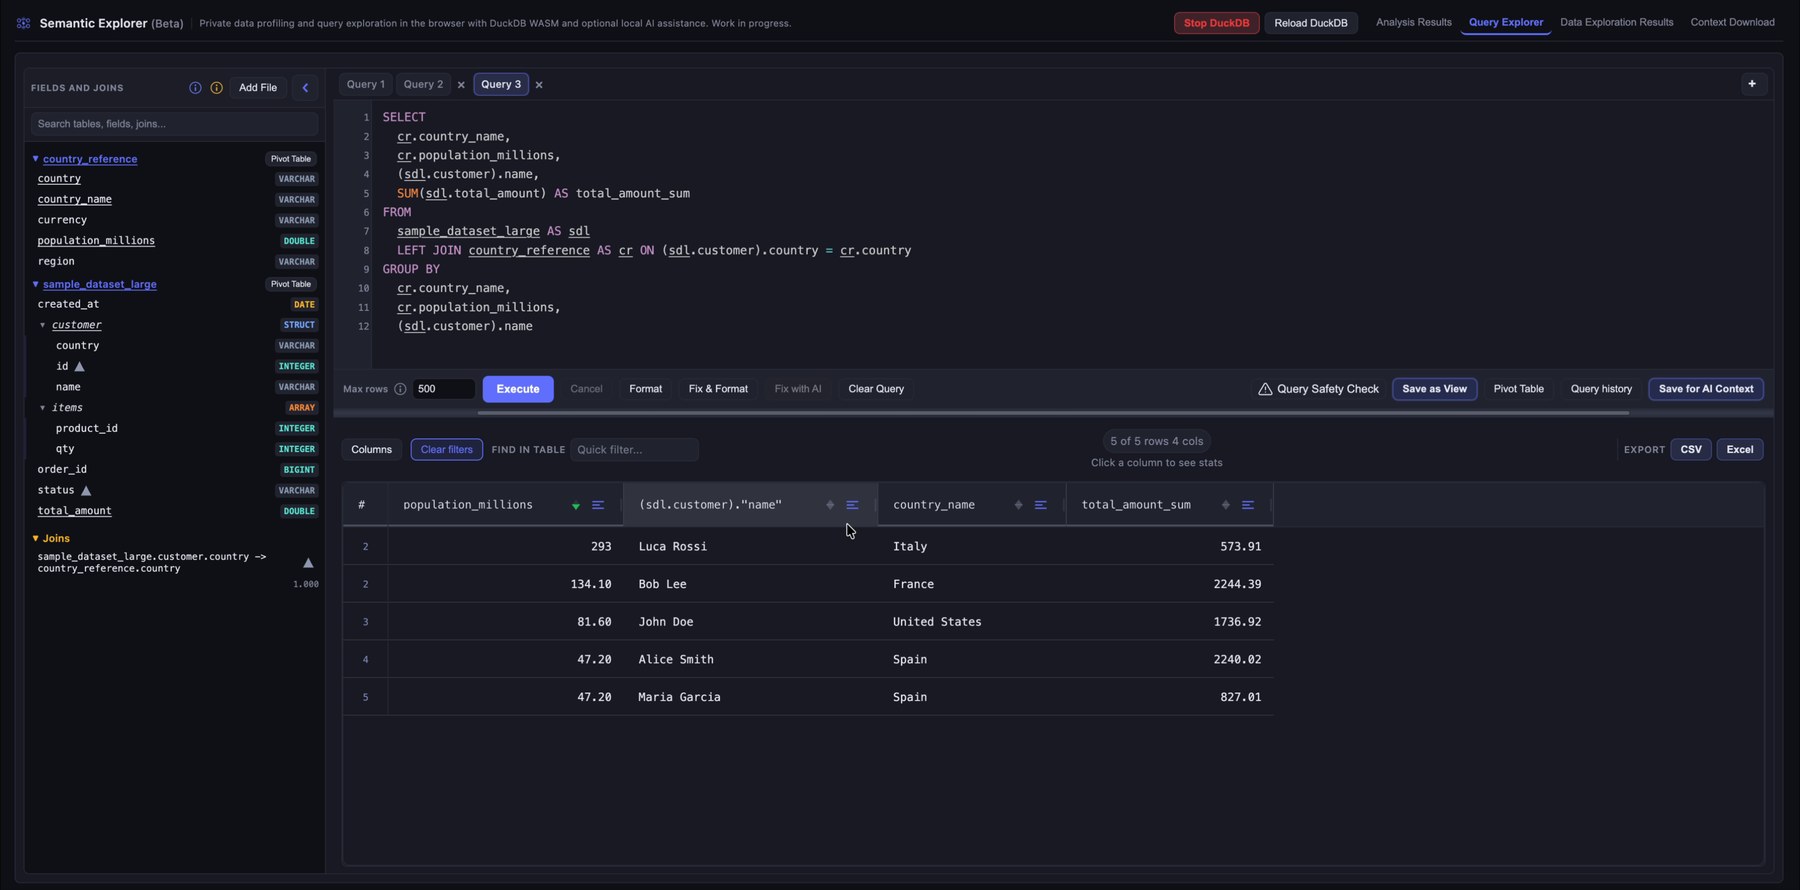
After the query runs, use the results grid to explore the data: reorder columns, sort and filter per column, search across the grid, and click a column header to open profiling for that column in the result set.
8. Explore results with a pivot table
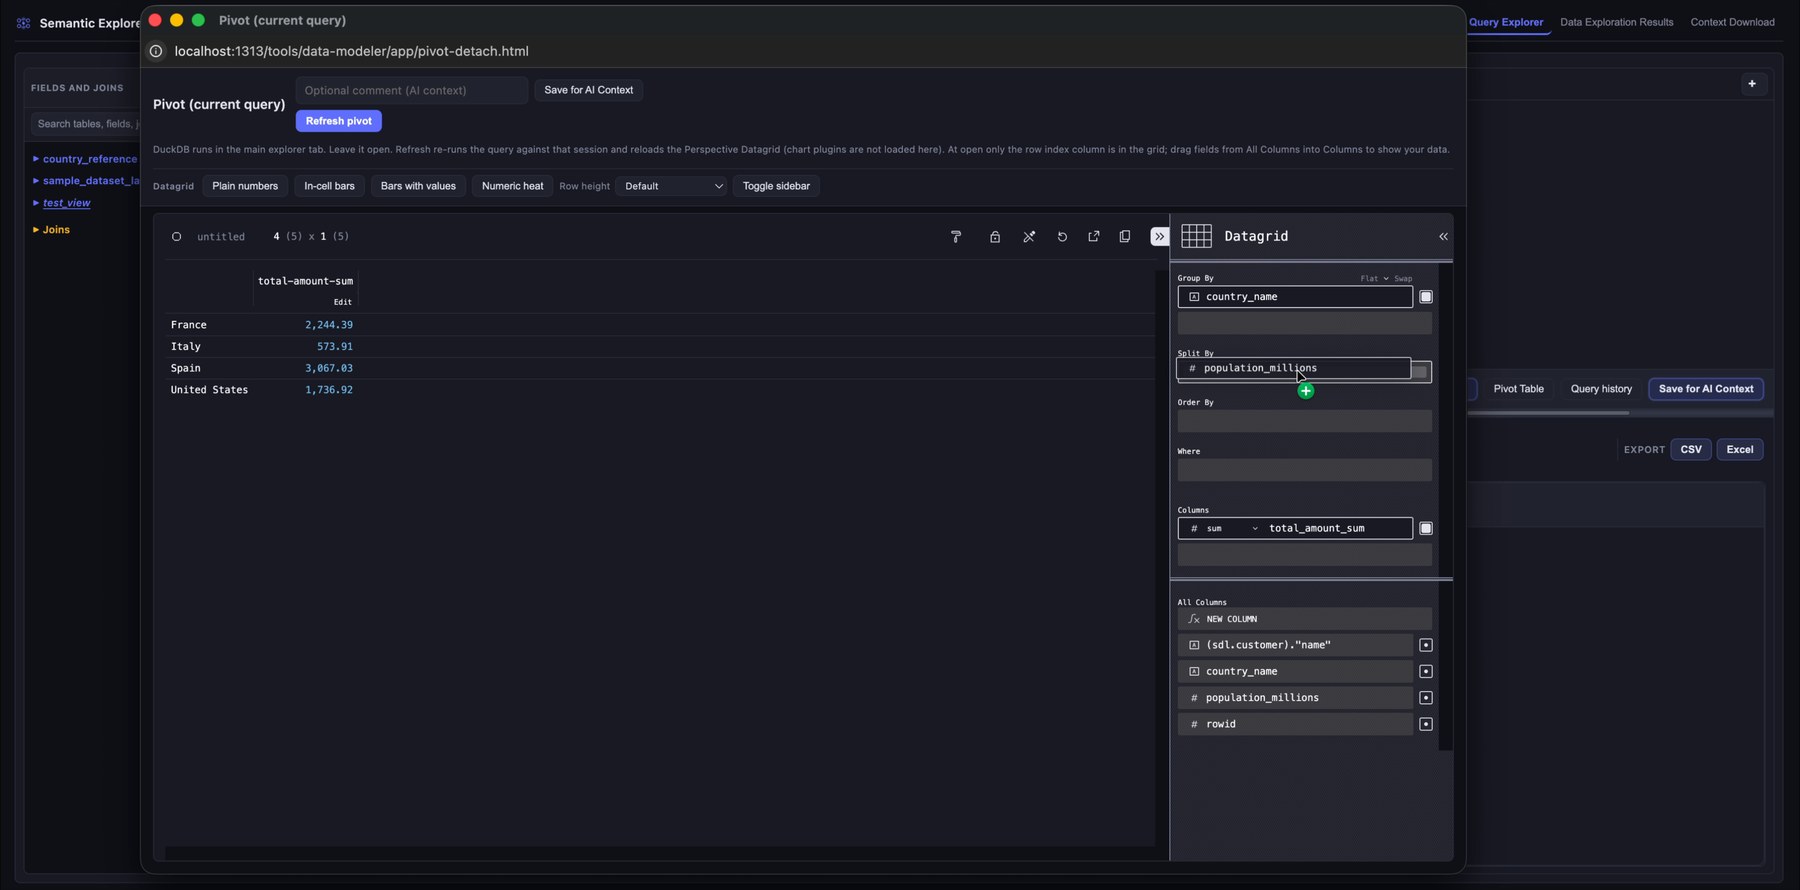
Open the pivot view to analyze query results visually. Drag fields into rows, columns, filters, and measures to aggregate without extra SQL. That supports exploratory analysis and quick metric checks.
You can also open pivot mode from a table or saved view using Pivot table next to the name in the left sidebar.
9. Filter queries and reuse query history
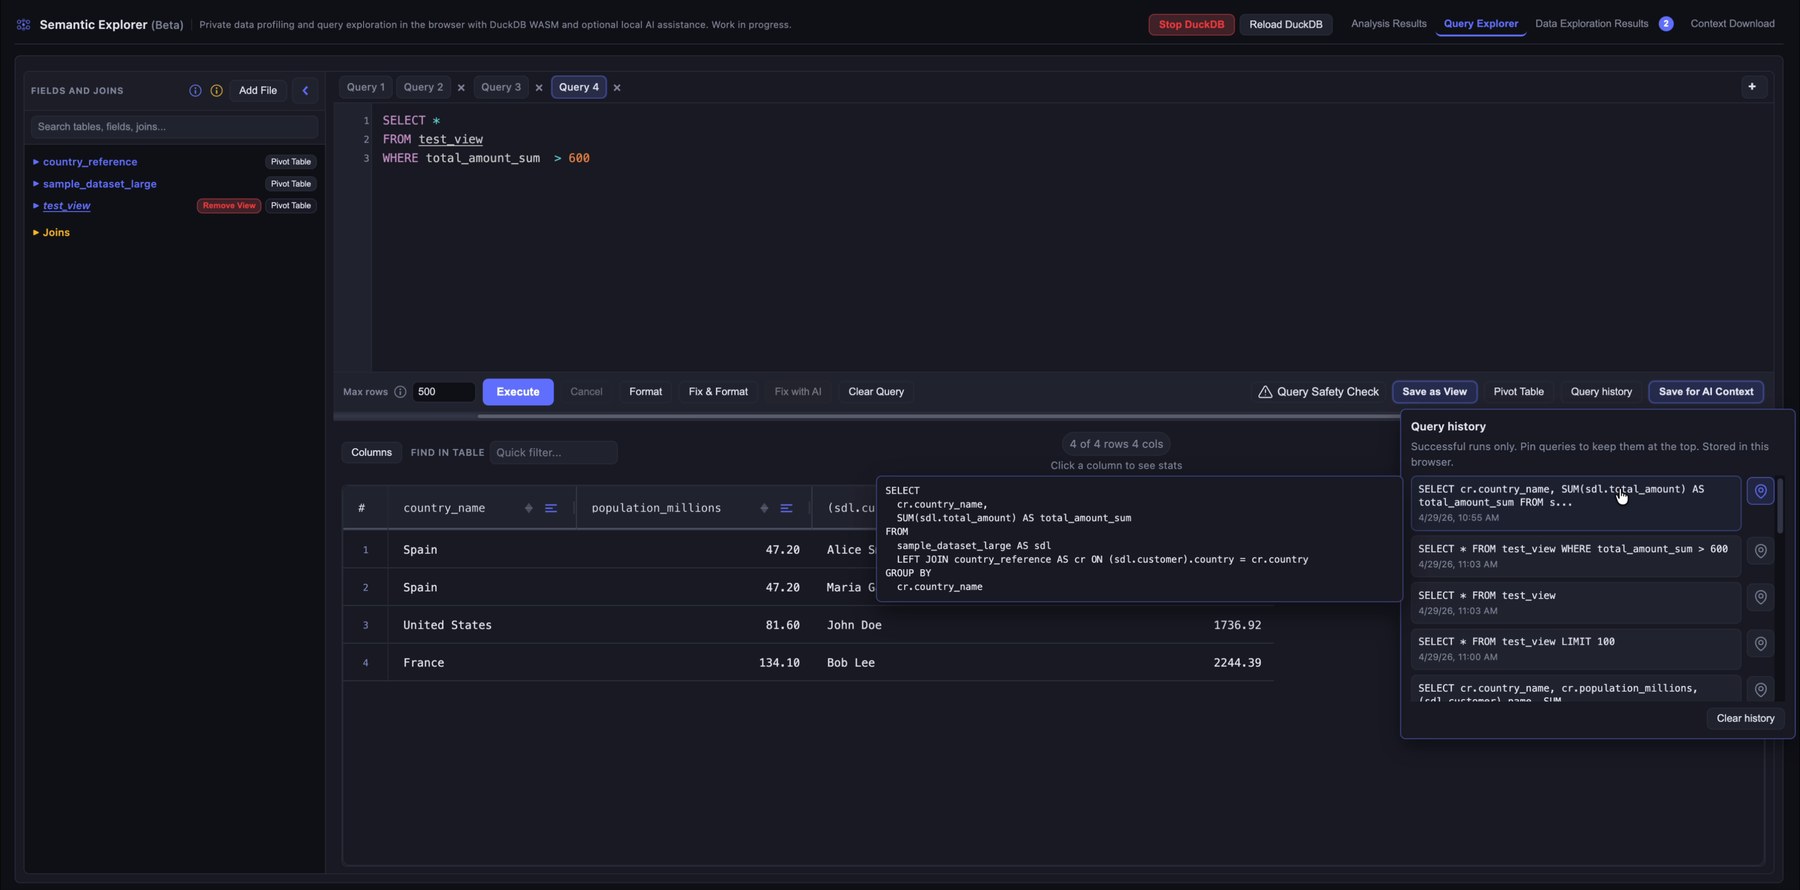
Successful runs stay in the session history so you can compare approaches or recover a query. Pin a query to keep it at the top of the list.
Save ad hoc analyses from the pivot view or the query editor. Each save stores the query, column profiling, and your notes. On the Download page they appear as raw detail and as consolidated context for assistants.
10. Download the generated AI context files
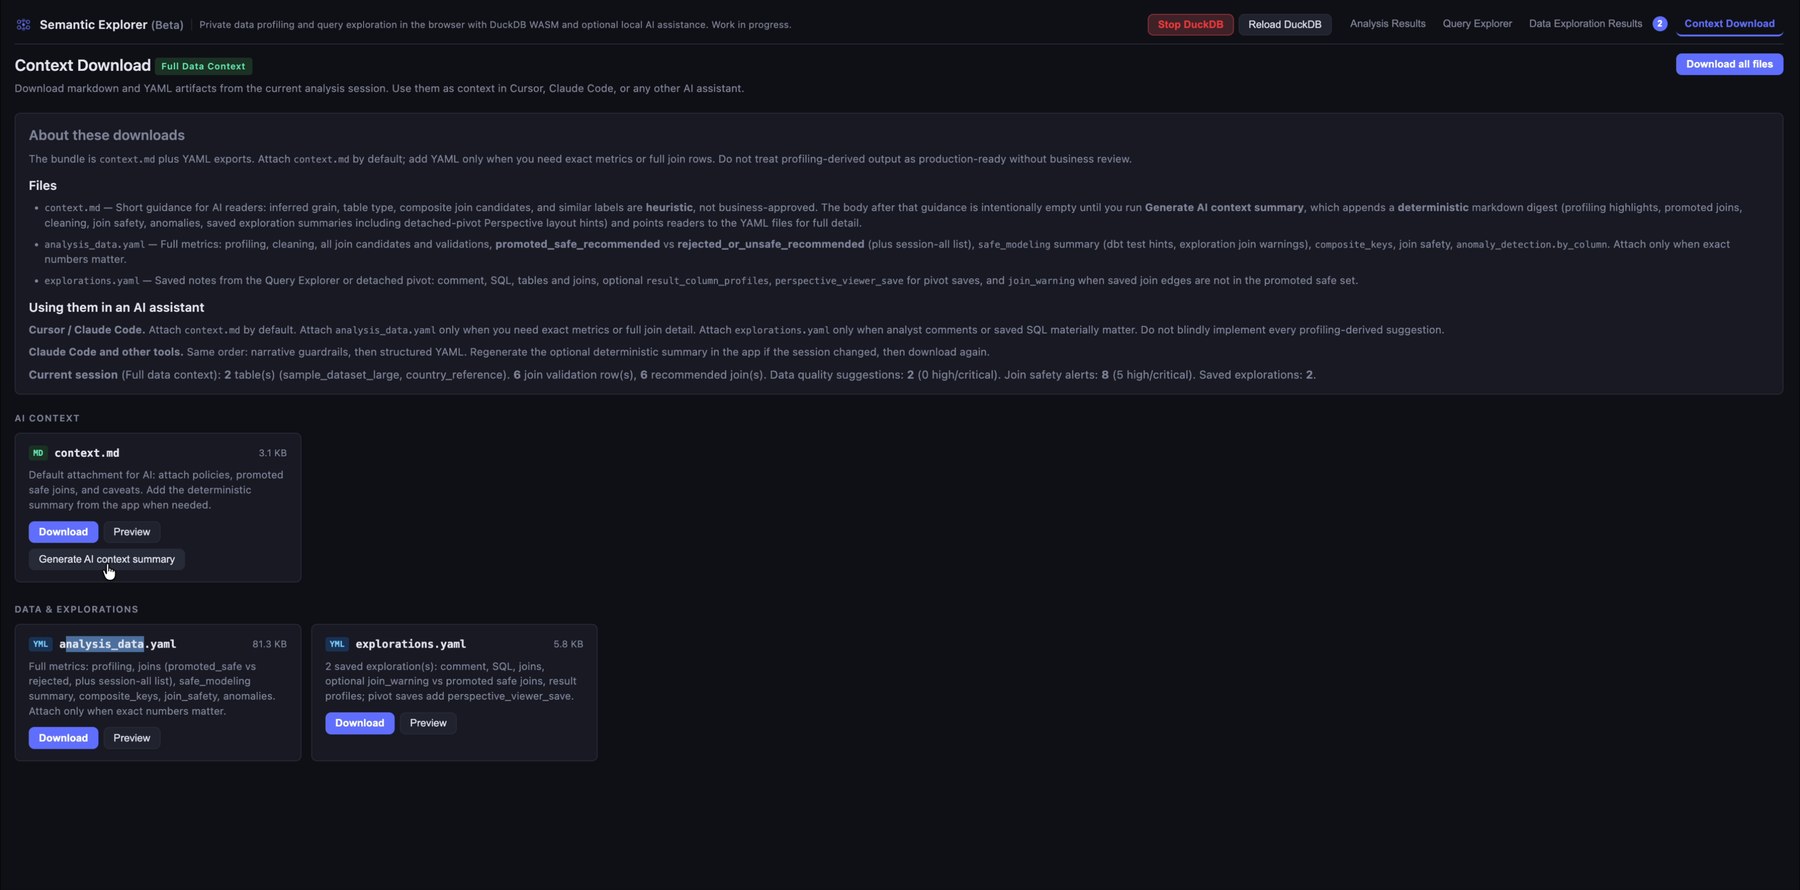
Download the generated context files: structured summaries, profiling, exploration notes, and assistant-oriented documentation for tools such as Cursor, Claude Code, or ChatGPT.
You get two YAML files, one for the automatic analysis (profiling, joins, anomalies, warnings, and related output) and one for your saved explorations.
There is also a summarized context.md. Click Generate AI context summary before downloading it; that step merges information from the other files into the summary.